Effortless Ways to Create Shopify Custom Reports

.svg)
.svg)
.svg)
Welcome!
Congratulations on beginning your journey to simplify your Shopify store data recording. With Report Pundit, generating customized, detailed reports using your Shopify data is a breeze.
Having worked with over a thousand Shopify merchants, we know the struggle of trying to get specific data you need about your store. And we’ve put a stop to that with custom reports.
Yes, Report Pundit goes all out to let you choose what your Shopify reports should contain. No more running through unwanted data for hours trying to pick out the values you need. With custom reports, you can save time as you master your Shopify data management.
“But how is that possible?”, you ask…
Now, we understand that it’s hard to believe all that we’ve said so far about Shopify data management. But we’re not blowing hot air; when we say Report Pundit has the stuff to make custom reports happen, we mean you can:
- Create custom reports in just a few clicks with an easy-to-navigate, intuitive user interface.
- Access ready-made reports covering multiple data categories that you can modify as desired.
- Save generated reports in the app itself. And save as many as you need.
- Add custom data columns, including calculated ones with your own formula.
- Get expert support to quickly create custom reports for you based on the criteria you give.
…and more.
This handy guide gives the details on how to make the most of these features. (We promise, it’s not technical, just practical).
Let’s begin.
Ways To Create Your Desired Shopify Reports
There are two ways you can generate reports in Report Pundit: .
- Using Premade Reports
- Creating Custom Reports
1. Using Pre-built Reports
Putting it simply, Pre-built reports (or ready-made reports, if you will) are to Shopify reporting what Ikea is to furniture. These are templates that allow you to create reports on various aspects of your Shopify business with just a few clicks.
They are constructed using our experience of serving over 10,000 customers, gathering inputs and feedback from them at every step of the way. This means you’re always in step with the industry when you use these templates while also saving time and costs.
Explore our library of over 120 ready-to-use templates, covering a wide range of reporting categories. Each template includes multiple relevant data fields presented as columns, and you can easily add additional columns along the way.
You can find these pre-made templates in the Library section of the app.
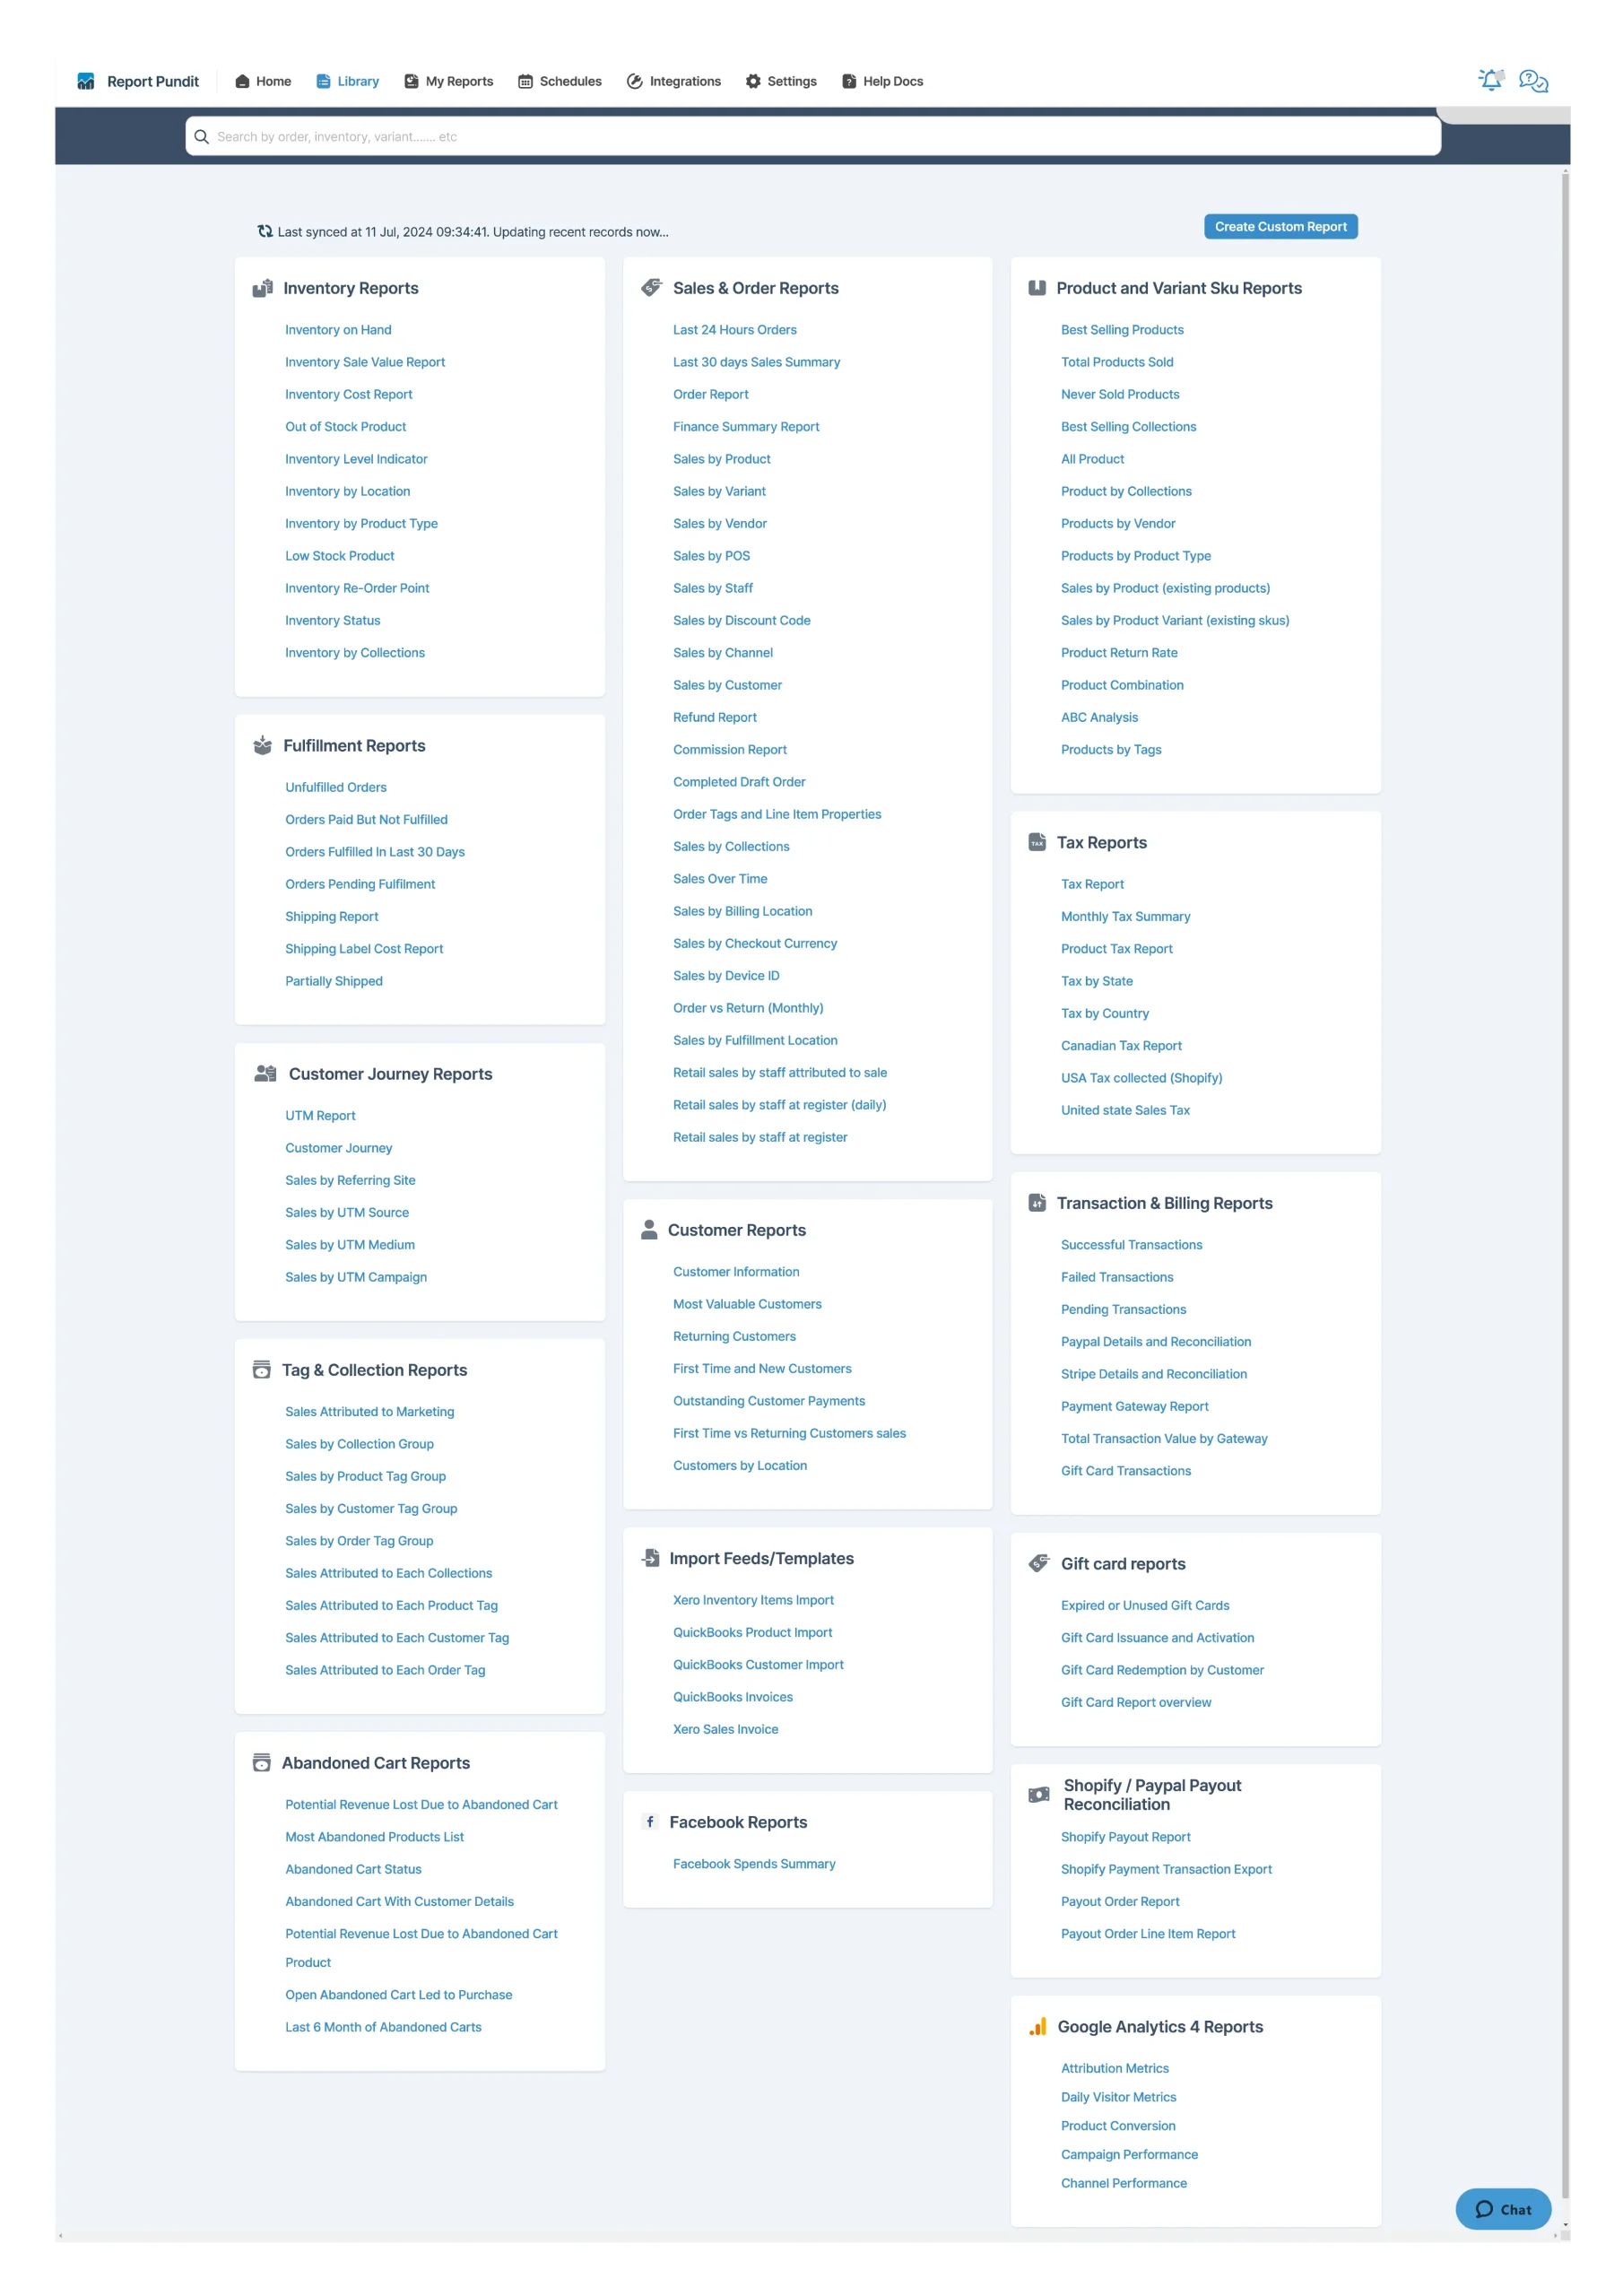
Navigate to the Library section of the app. There, you’ll find many templates organized by category. Find the template you want under the relevant category and simply click on it.
A report will be presented to you with the relevant data fields filled with your Shopify data. If you want, you can add more data columns by clicking on the “Add columns” or “Need Custom Column?” options as required.
Let's walk through template-based report creation using an example.

As you can see, the desired report appears with data related to the template category and report type you have selected. You can make any change to the report table with customization options like adding columns, filters, sorting, etc. You will find more details about these customization options in the next section.
Using Custom Report Builder
In case our vast number of available pre-made templates can’t meet your reporting needs, we’ve got custom report creation. These are the reports you define and shape to only show the data you want.
We’ve made creating custom reports just as easy as generating template-based reports using our years of experience and inputs from our 10,000+ customers.
With the Report Designer tool, you have full control over customization. Format your report, apply filters and sorting, select preferred date ranges, and add multiple data columns per your convenience.
How To Create Custom Reports?
We’ve made sure that the option to create custom reports is always within your reach. Just click on the Create Custom Report button in the Library page. Or, click on the Create Report button in the My Reports page and select the Custom Report option.
Name the report and add optional comments in the pop-up that appears. Then, choose your preferred report category in the next pop-up. You should see a report generated like the one shown below.
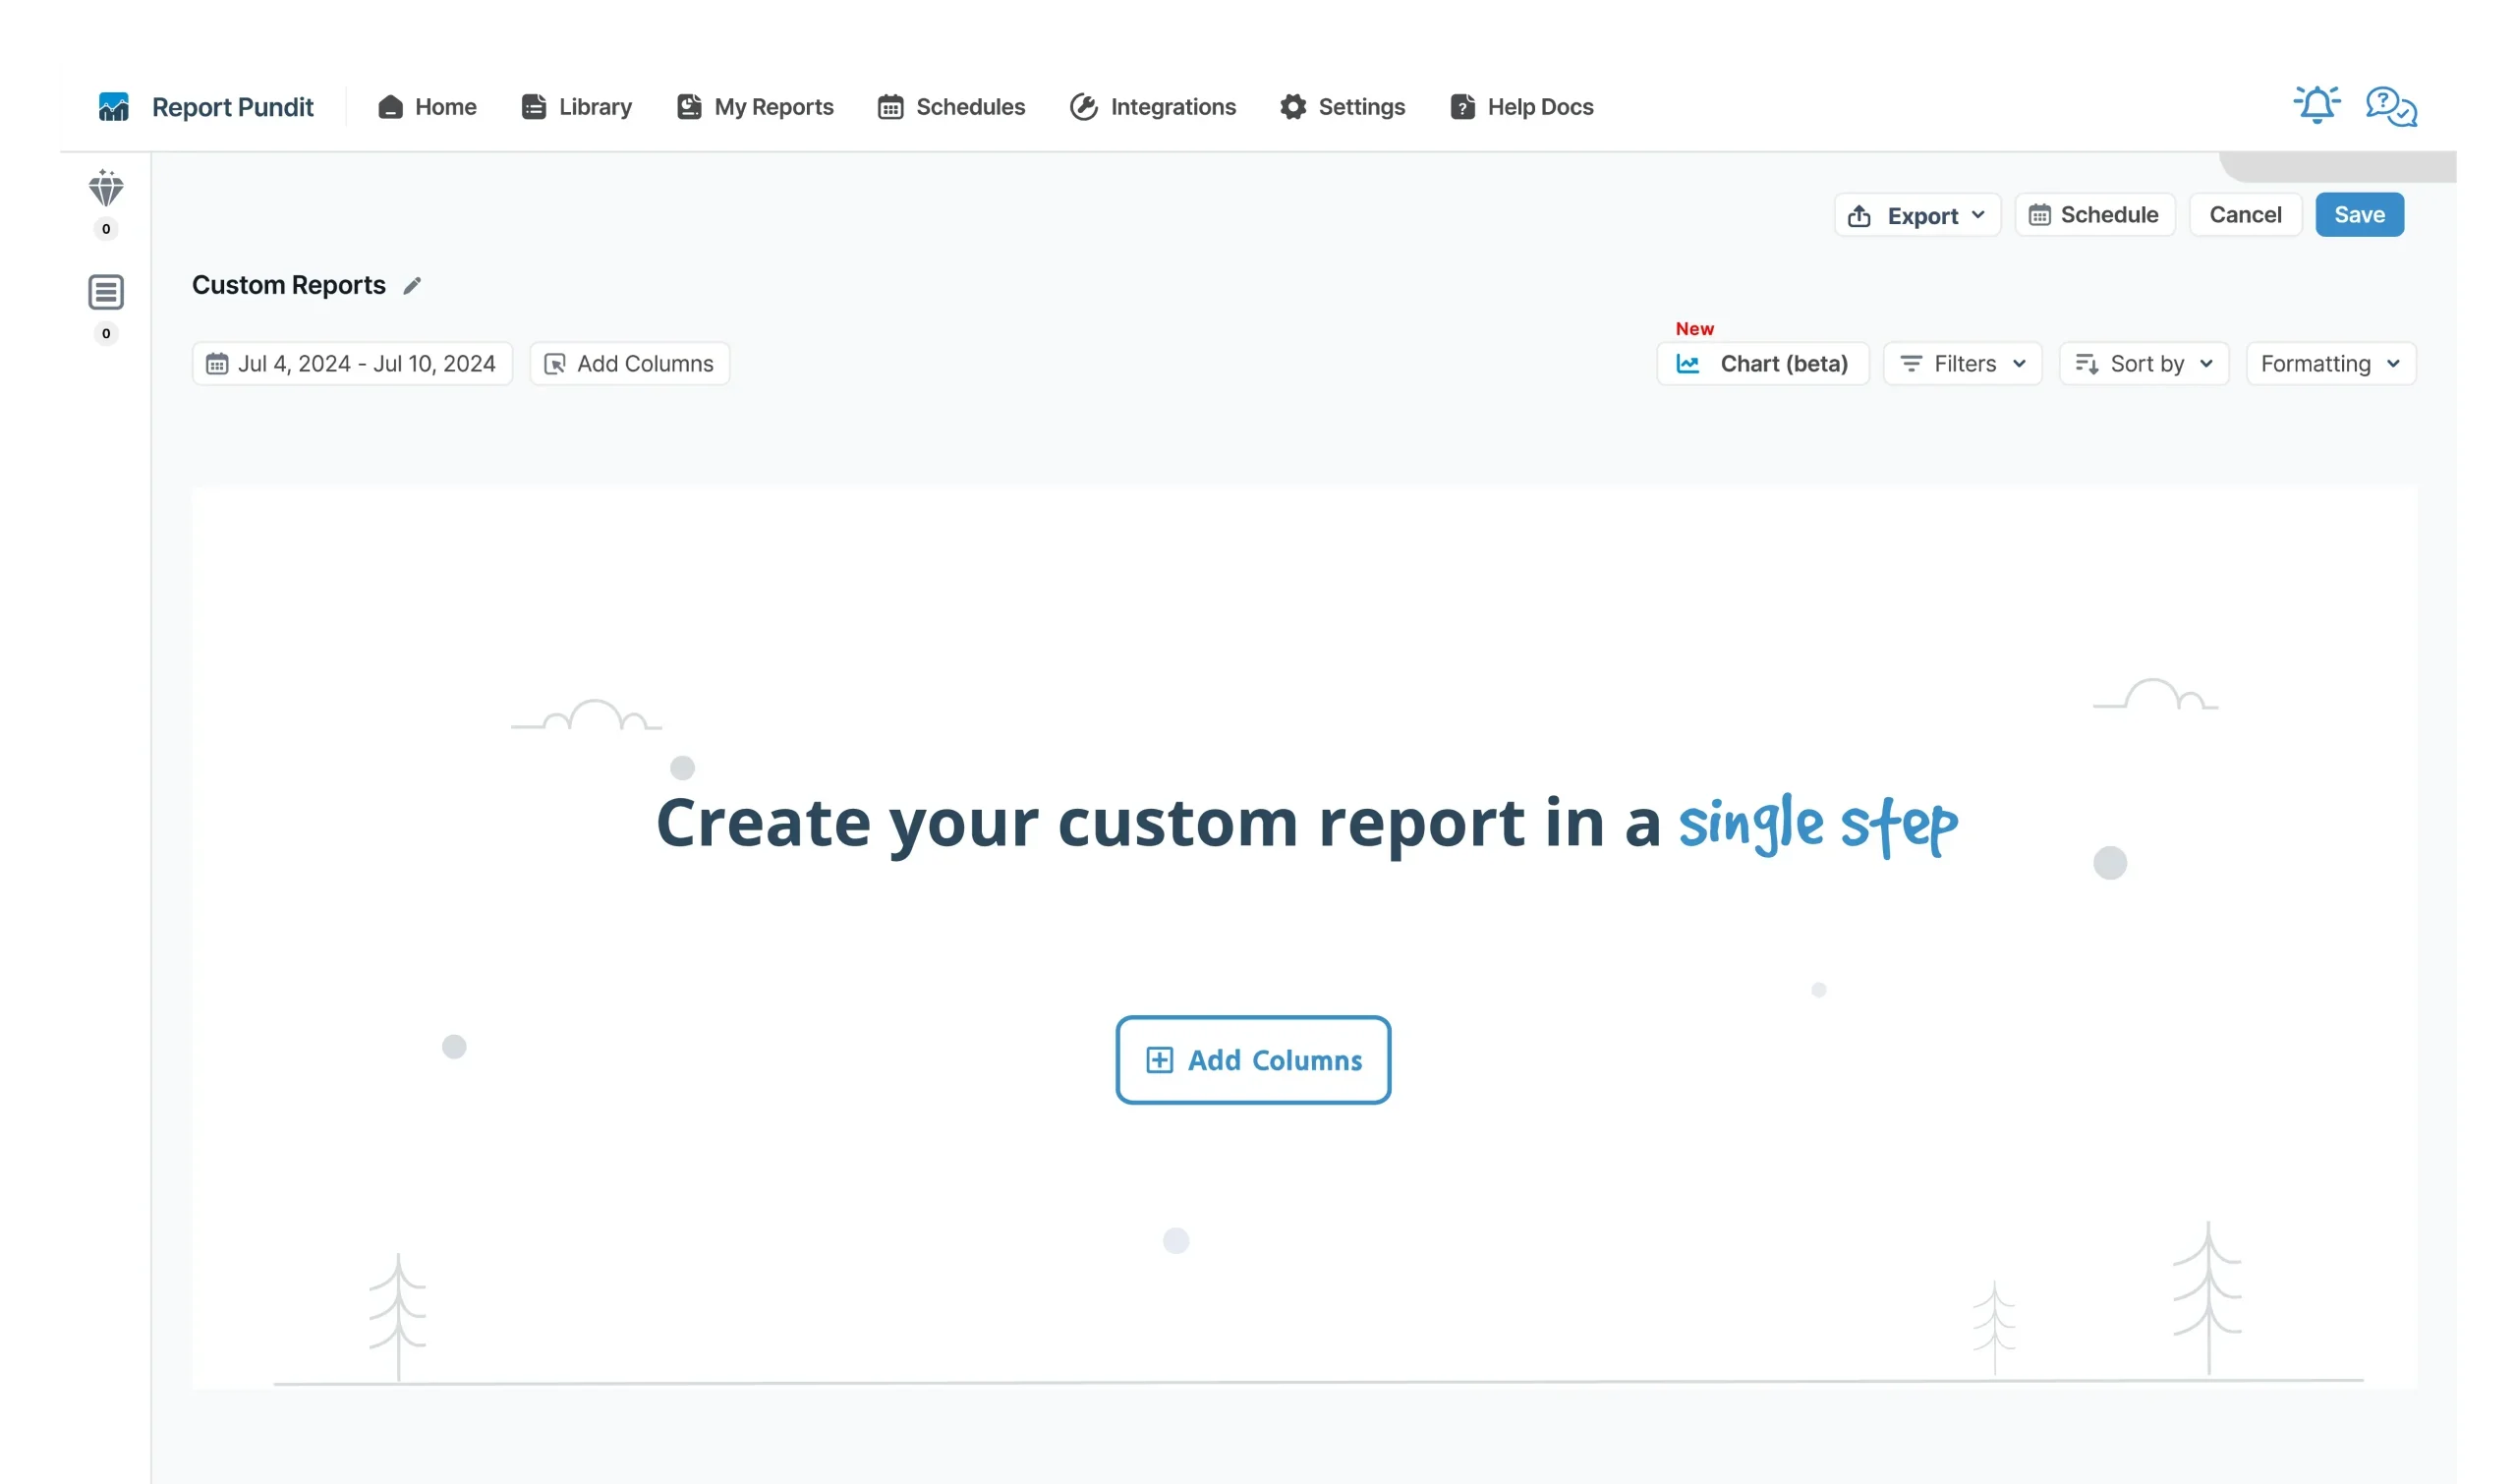
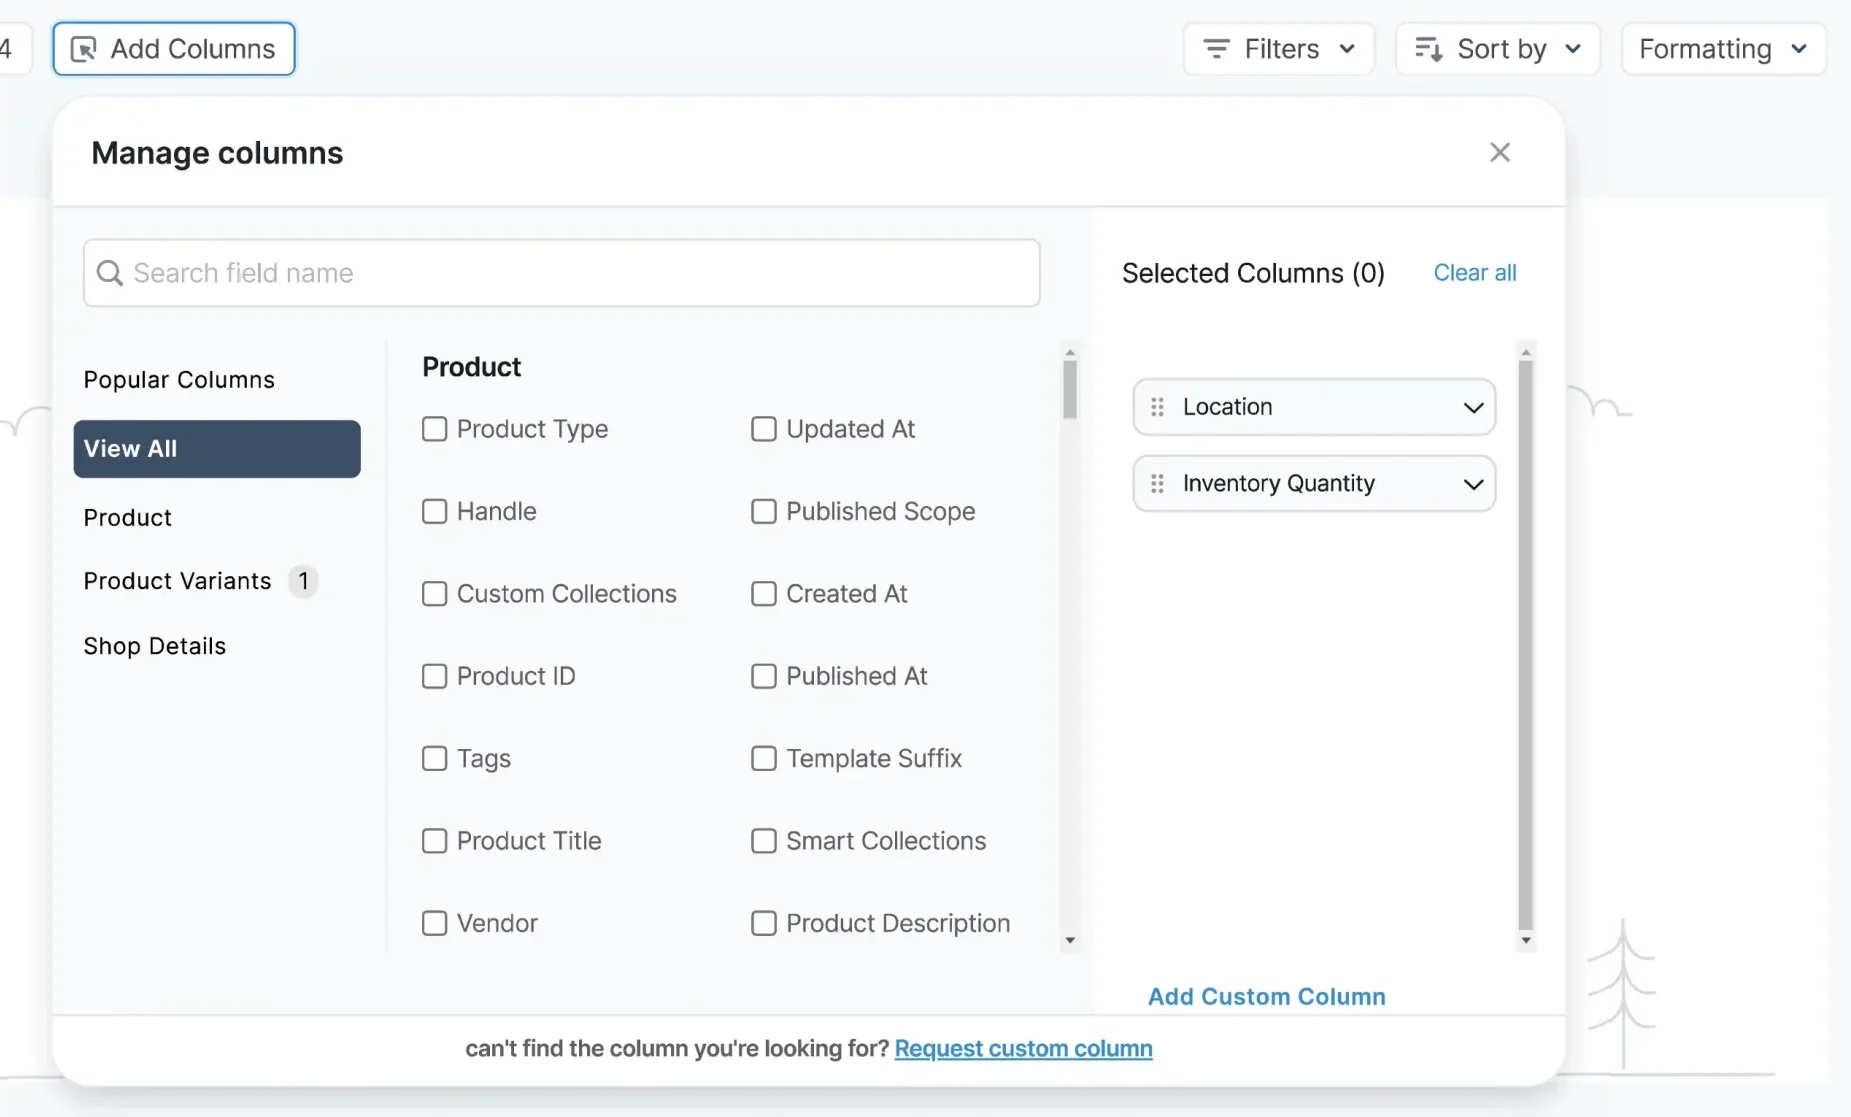
Now, you simply have to select the data fields you want in your report. The designer tool will handle the formatting and layout based on your customization preferences.
By selecting the appropriate fields, you define the report for your specific use case. Meaning, you create a customized report that suits your specific needs and requirements.
If you need to create a report all by yourself, don't worry - the report designer tool makes it easy and straightforward.
Even better - You can add Static and Calculated Columns to your report.
Making Use of Static and Calculated Columns
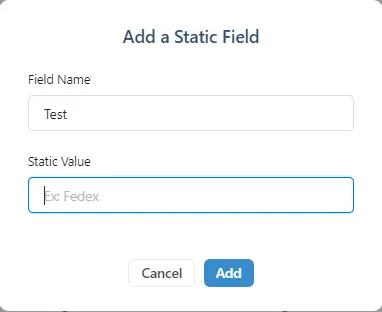
A static column is designed to display consistent, unchanging values that do not require any calculation or manipulation. For example, it can be used to display a company's logo or a specific note about a particular record.
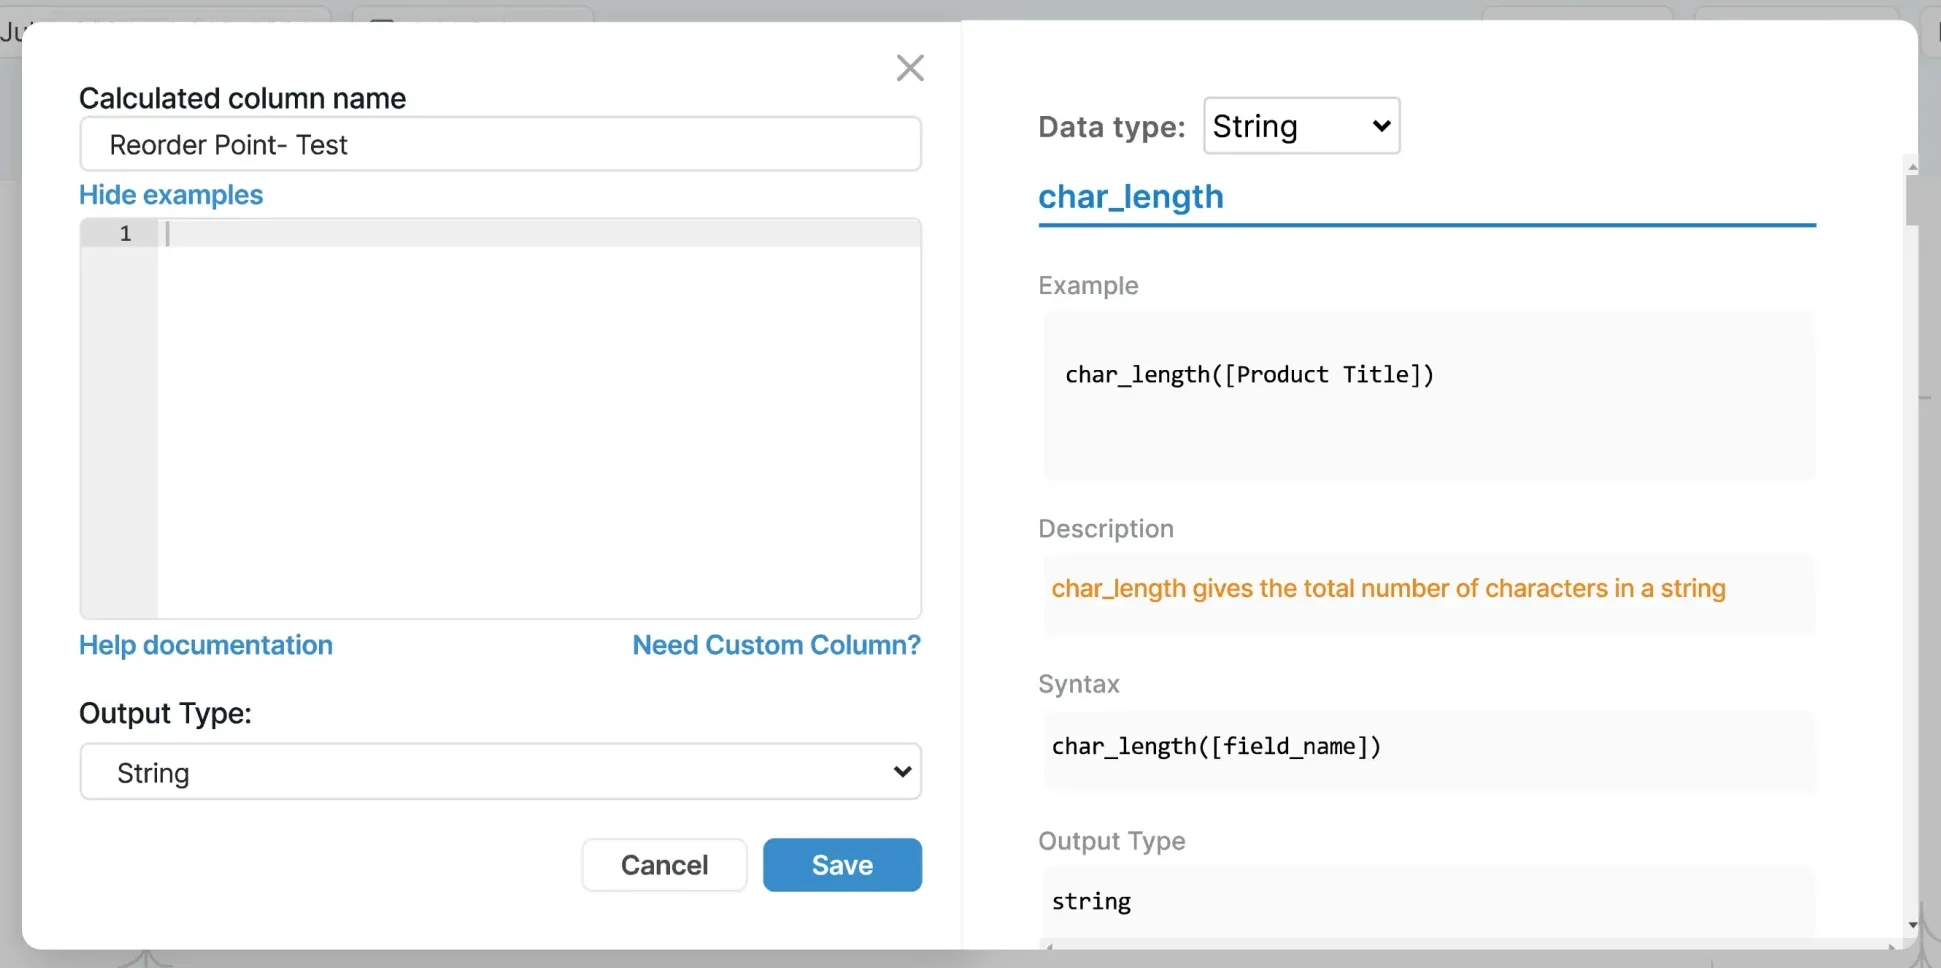
On the other hand, a calculated column displays calculated data based on SQL query inputs. It extracts data from the database and uses a formula or query to obtain the results.
The use of static and calculated columns allows for greater flexibility and customization when working with data. You can take advantage of both column types to create a well-rounded, detailed report that meets your specific requirements.
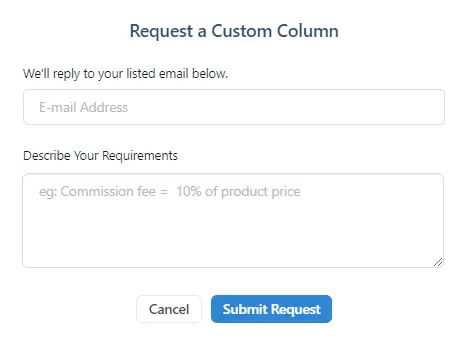
Still feeling overwhelmed about creating custom columns? Don’t worry. Just reach out to our expert customer representatives to have those columns created for you.
Exploring Report Customization
Now that you are ready to create both Premade and Custom Reports, you can delve deeper into Report Designer to make the most of your reporting.
Date Range
Report Designer provides the option to select the date range for your reports. When selected, you’ll only view data within that range.
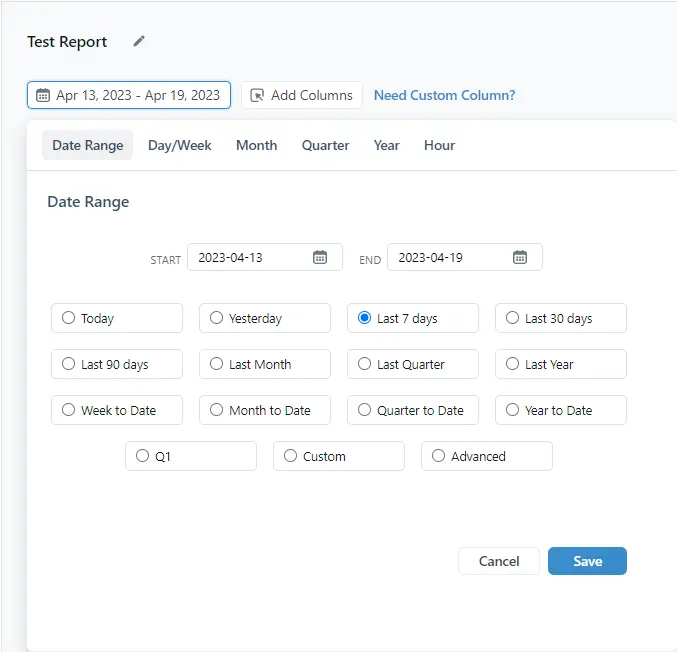
You can refine the data range by hour, day, week, month, quarter, and year. Furthermore, the Advance option displays data from present day to a chosen number of days, weeks, or months in the past. You can do the same with the Custom option by selecting the exact date range via a GUI calendar, and additional hour settings.
Filter Condition
If you want to see a specific dataset based on certain criteria in your reports, use the Filter option in Report Designer. Filter any data column with various preset conditions available in the Filter tab.
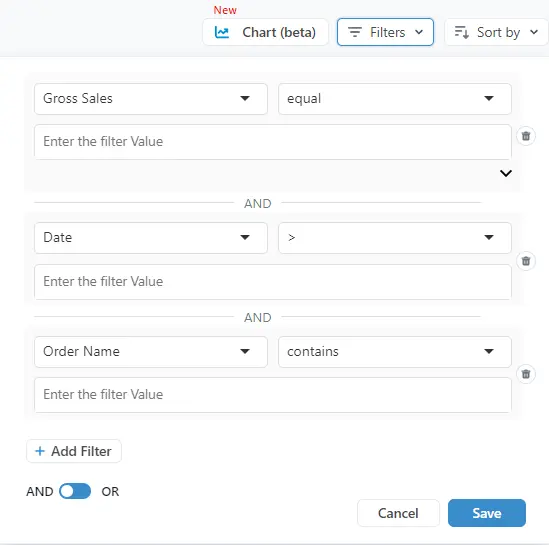
You get filter conditions based on the data field you select and the data available in the columns.
Add multiple filter conditions to your reports using the AND and OR functions available in the filter tab.
Sort Condition
Arrange the data in your reports in the order you want with multiple Sort conditions. Use the Sort by option to select the number of data rows you want to see in your report. For example, if you select Top 25, you’ll only see data of the top 25 items being reported on.
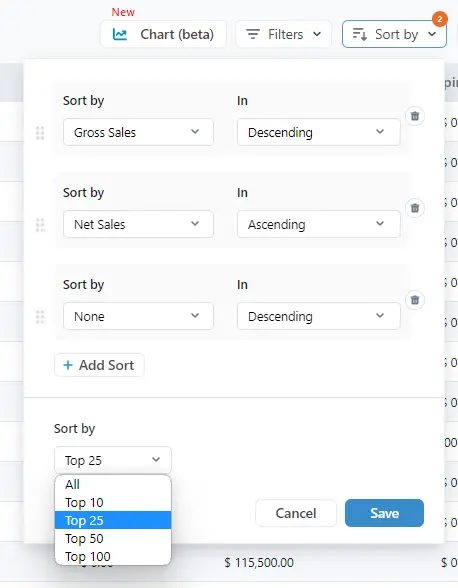
Note that you cannot apply two sort conditions to the same data column.
Charts & Data Visualization
A picture is known to speak a lot of words. In Report Pundit, pictures take the form of Charts. This newly introduced feature lets you view your report as clear, vibrant visualizations packed with its data points. Charts enable visual data analysis to improve your critical decision-making process at the click of a button.
To access it, just head to the top right corner of a report and click on Charts (beta). You’ll see a graphical view of your report’s data. When done, click on Switch to Table to view your data in a table again.
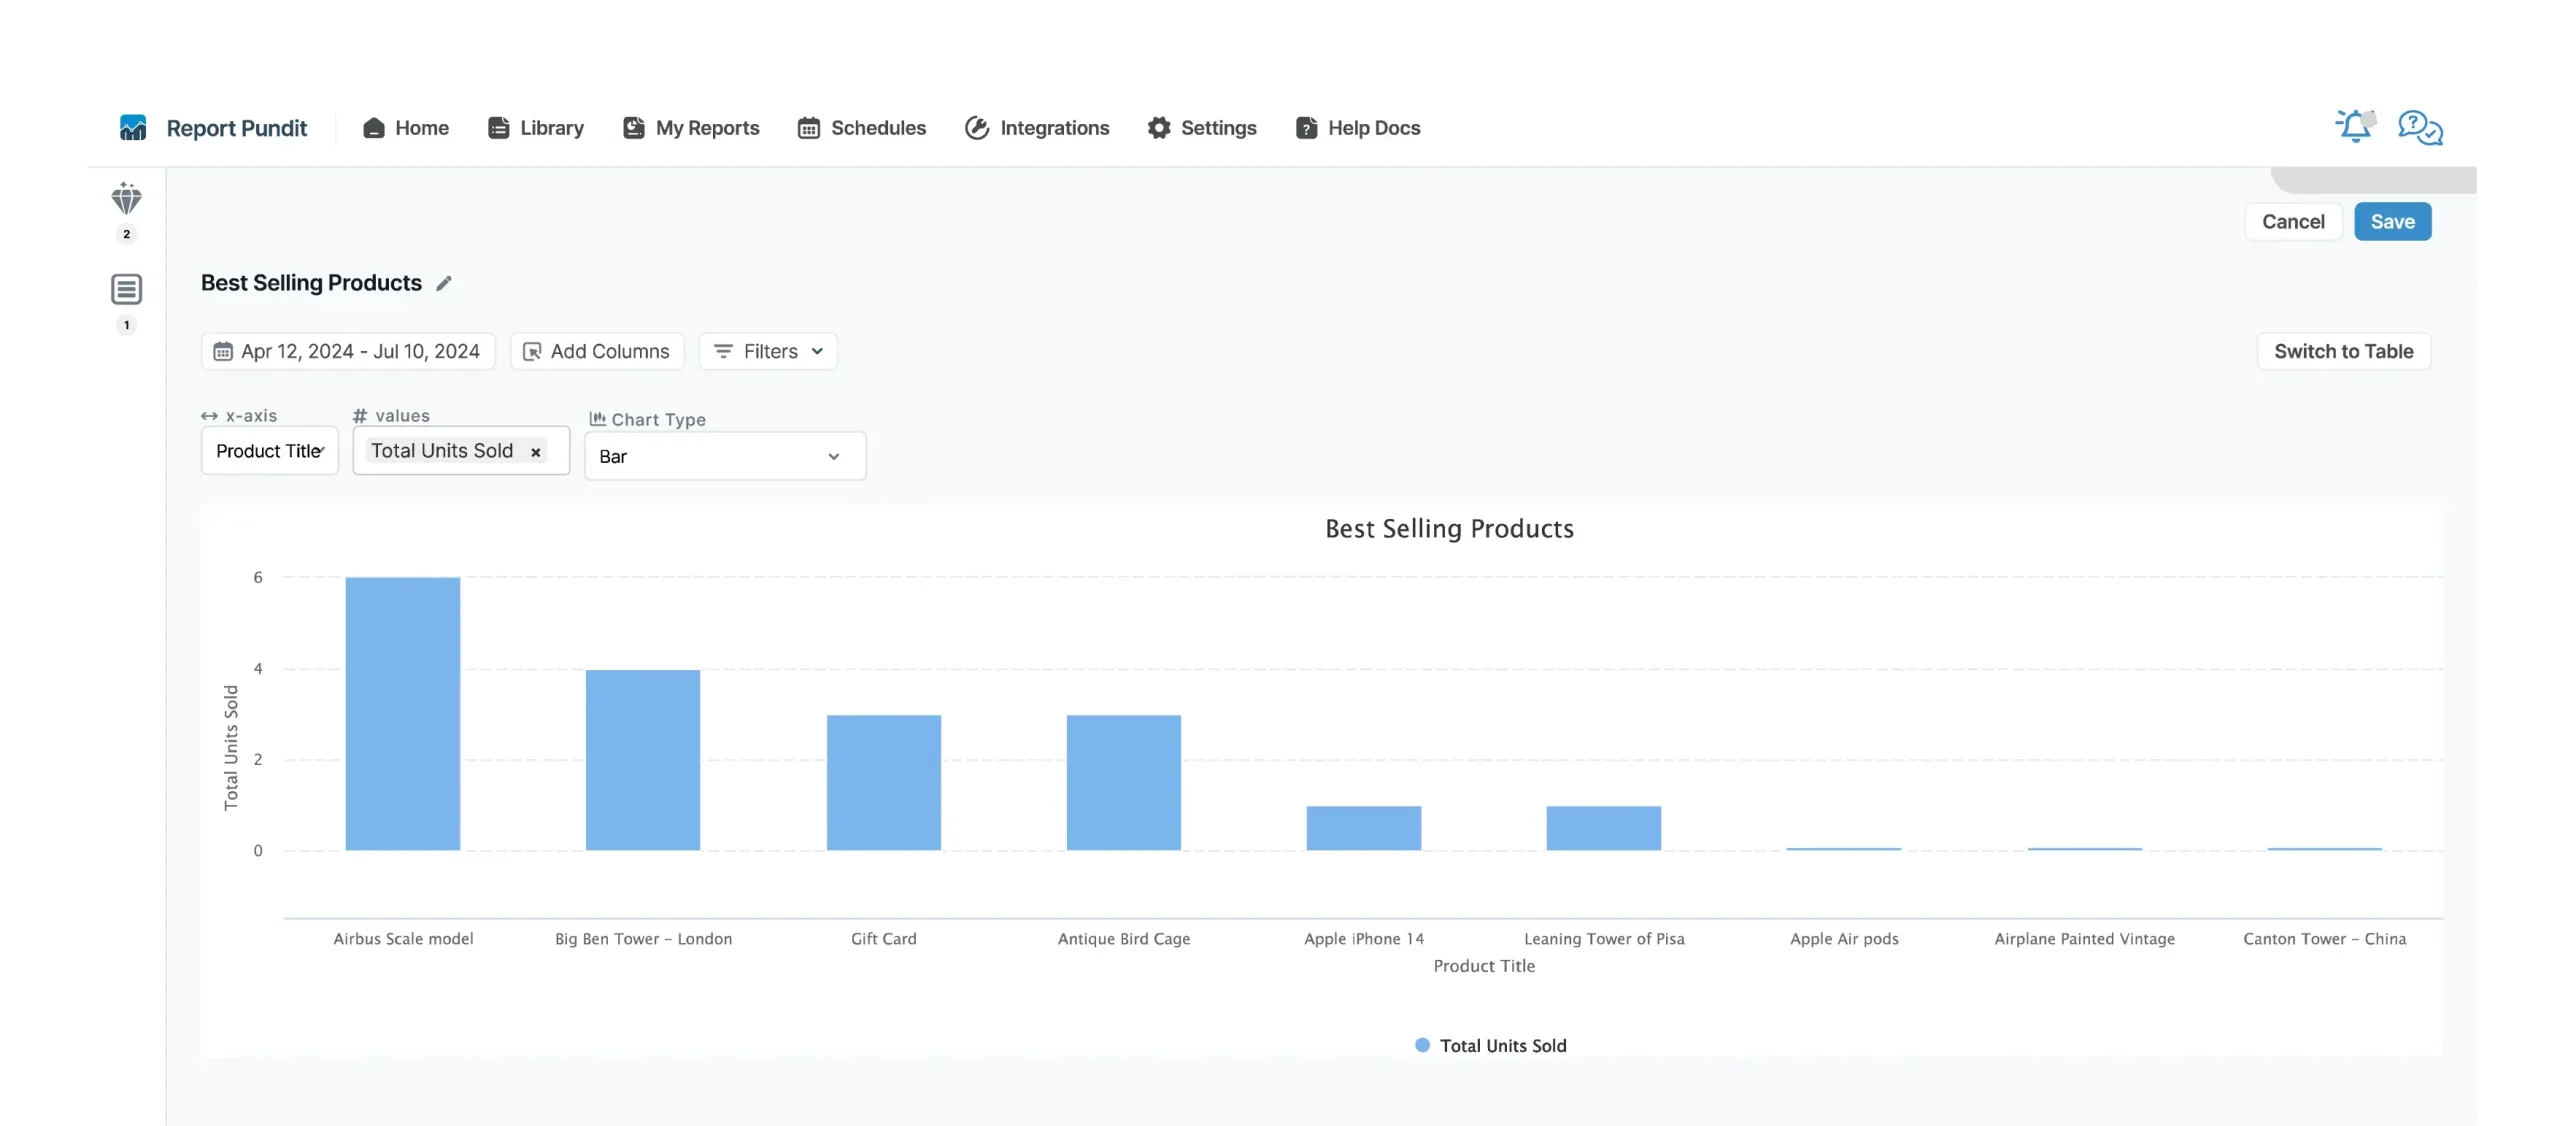
To keep things interesting and informative at the same time, you get 5 chart types to choose from.
->Line: Visualizes report data in the form of colored lines.
->Bar: Presents the data as a series of colored bars
->Stacked Bar: Places one bar over another using different colors
->Area: Similar to a line graph but with colored shading of the relevant area
->Stacked Area: Places one area graph over another with each shaded in a different color
Note that Charts are only available in some reports based on applicability.
Combining Third-Party App Data
Your Shopify third-party app data is never out of reach with Report Pundit. In the app, you’ll find dedicated ready-made reports with third-party app data Google Analytics, PayPal, Facebook, and more.
For more personalized reporting, you can add custom columns with external app data in your custom reports. Report Pundit can directly connect 30+ popular third-party apps across categories and get their data.
You can learn more about connecting third-party apps to Report Pundit in our dedicated Integrations section and help documentation.
The quick-look version is below:
- Marketing
Check in on how your marketing campaigns are doing across platforms. Apps here include Amazon Ads, Bing Ads, Facebook, TikTok, Google Ads, Google Analytics, Yotpo, Snapchat, and UpPromote.
In terms of data metrics, you can have UTM data, Ad spend, Visitor traffic, Visitor source, Bounce rates, Click Through Rate (CTR), Conversion Rate, Commissions owed to affiliates, etc.
- Payout (Payment)
Get all your payments data from your third-party payment processor like PayPal, Authorize.net, Klarna, Stripe, Square, Sezzle, and more.
Metrics here include Payout, Payment Processor Used, Charges and Fees (like Conversion Fees for international payments), Invoice data (Date, Invoice no., Terms, etc.), among others.
- Returns
Know what you owe in refunds for returns by connecting apps like Returnly, Rich Returns, Loop Returns, and Return Prime. The data metrics you can get under this category are Returned Quantity, Net Returns, Tax Returns, Shipping Returns, and the like.
- Shipping
Draw in the data about products you send away via shipping with connection to apps like Ship Hero, Shippo, Ship Bob, Ship Station, FedEx, and Print-on-Demand services (Printful, Printavo).
- Subscriptions
Never lose track of your third-party subscription app activity by connecting apps like Bold, Loop Subscriptions, Seal Subscriptions, and Recharge (for subscription payments).
You can refine this data further by applying the filter and sort options mentioned above.
Report Exporting and Scheduling
Report Pundit is all about the hands-off approach when it comes to report delivery with automated Scheduler and Exporter. Simply choose your preferred time, destination, and file type in the scheduler and your desired report will be forwarded accordingly.
You can choose to export reports directly in Excel, PDF, or CSV formats to your device or Google Sheets. Reports can also be scheduled to Email, FTP, Google Sheets, Power BI, and BigQuery. Output file format options include ZIP, PDF, CSV, and Excel.
You can reach the scheduling menu by clicking on the “Schedule” button inside a report. Another way is to click on the schedule icon of your desired report when in the My Reports section. Alternatively, you can change your preferred auto-export options when rescheduling reports in the Schedule section.
The Export button within reports sends a report file in your preferred or default format to a set destination or your device.
Find a glimpse of the scheduling and exporting feature below:
Some data in a report will often show changes in value, while other data may not change frequently. Some data values may even remain unchanging, such as those in static columns. This flexibility lets you alter your report generation timing to suit your preferences, such as monthly or hourly.
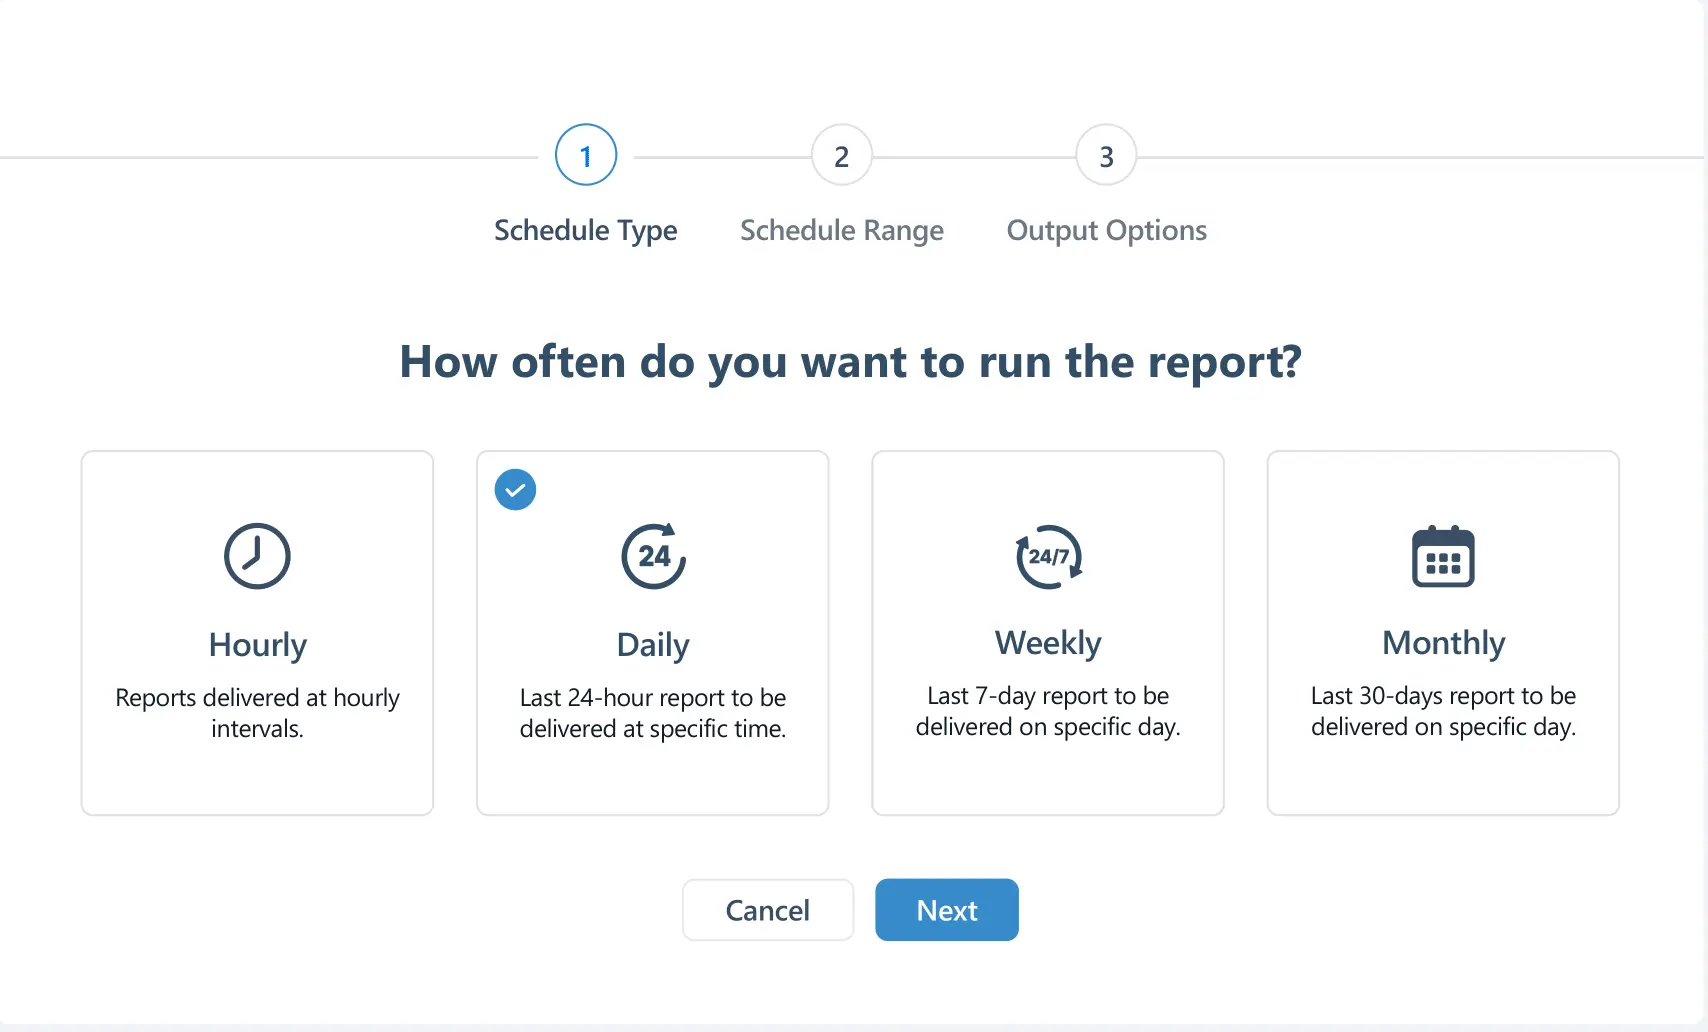
Advanced Report Scheduling
In the above section, we discussed the scheduling options available in Report Pundit. However, that’s not all you get with our app. We also have Advanced Scheduling options for enhanced report exporting.
Image for Reference:

When scheduling reports, choose the export destination, file format, and attachment type (file, link, or zip).
As mentioned earlier, with scheduling, you can select your preferred Email ID as the destination. You can not only add an email address, but also CC recipients, and include a subject title along with personalized content. You’ll find it in the Output Options stage of the scheduler.
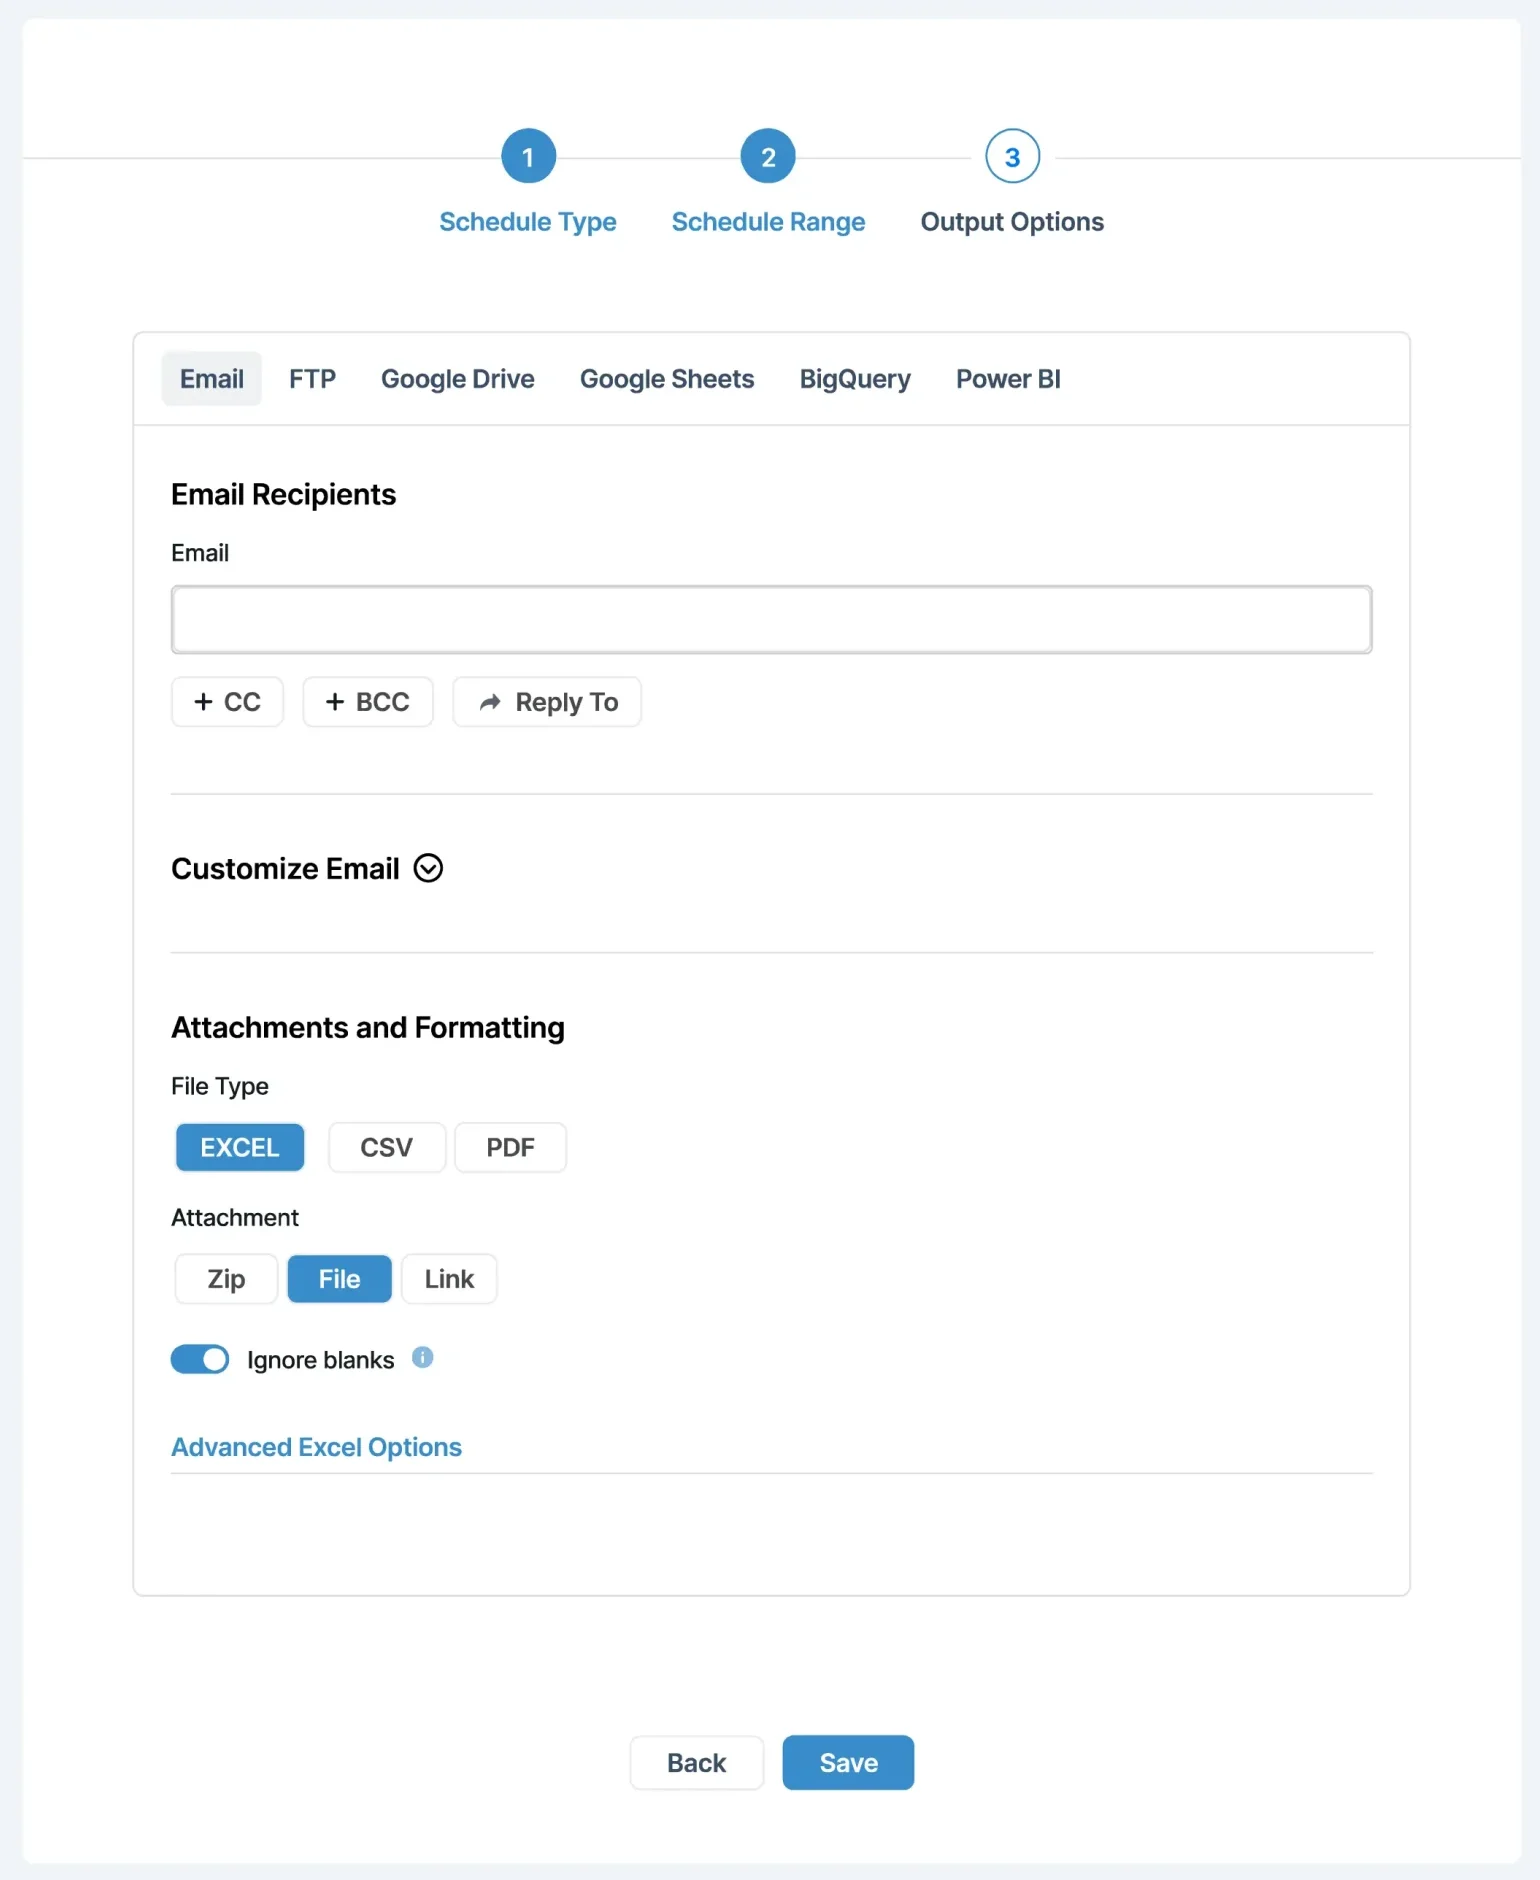
You also have access to advanced Excel options that let you edit the header, change text color, adjust text size, and modify text alignment.
Advanced Shopify Reporting Experience
You’ve reached the end of this article, and what we believe will be the start of your empowered Shopify reporting experience. With the above-mentioned tips and guidelines, you can conveniently start creating custom reports with Report Pundit.
Since we’re really into solving data reporting issues for merchants like you, Report Pundit comes with more beneficial features like:
- Multi-store data consolidation
- Unlimited free report creation service
- 2000+ data fields from API
- Unlimited Report Storage
…etc., for Shopify store analysis.
Need more details about how to make the most of Report Pundit? Navigate to the Help section for all the documentation you’ll need to become a pro.
And if there's anything you find we’ve missed in this guide, don't hesitate to give us your feedback. We're always looking to improve how we serve you.


Build and automate your Shopify Reporting
Unlock the full potential of your Shopify store with Report Pundit. Gain access to over 2000 data fields, automate reports, and make data-backed decisions to grow your business.