Essential Insights on Shopify Reports


.svg)
.svg)
.svg)
E-commerce merchants around the world use reports on finances, marketing, sales, and inventory, to track their store growth, make important business decisions, and to run day to day operations. They’re a fundamental resource for online sellers.
Failure to review these reports may result in flawed decision-making, affecting the store in the long and short term future.
Understanding this reality, Shopify has provided its customers some of the best e-commerce reports online. From finances to inventory and everything in between, Shopify enables a wide range of report features of which a merchant can take full advantage.
In fact, we’ve created an extensive guide on these reports explaining what they are, how they work, and how you can use them to get the best results.
Here it is: The Complete Guide to Shopify Reports. Now, let’s look at what Shopify reports are and why they’re important.
What are Shopify Reports?
It is a feature of the platform that provides a suite of tools for analyzing store operations and data. It’s a built-in functionality available for all Shopify plans.
Alright, that seems a bit technical so let’s break it down. Your Shopify store produces a tide of data during operations to capture. Shopify Reports take that data, categorize it into different types (like Sales, Finance, etc.), and display it to you in the form of easy-to-read tables and graphs.
There are two ways to create reports:
1. Using Default Reports
Think of these reports as takeaways at a fast-food drive through—you’re hungry for some data and want it fast. So you arrive at your Shopify store account and find a menu of reports that Shopify has ready. You order the report you want, say Sales over time, and in a few moments get it.
It’s the convenient option that lets you carry on running your store while having the data you need for it.
2. Using Custom Reports
When default reports don’t give you the data dining experience you want, you can create custom reports. Shopify lends a hand here again with some custom report templates, a list of data columns, filters and more.
Let’s look at a quick plan comparison:
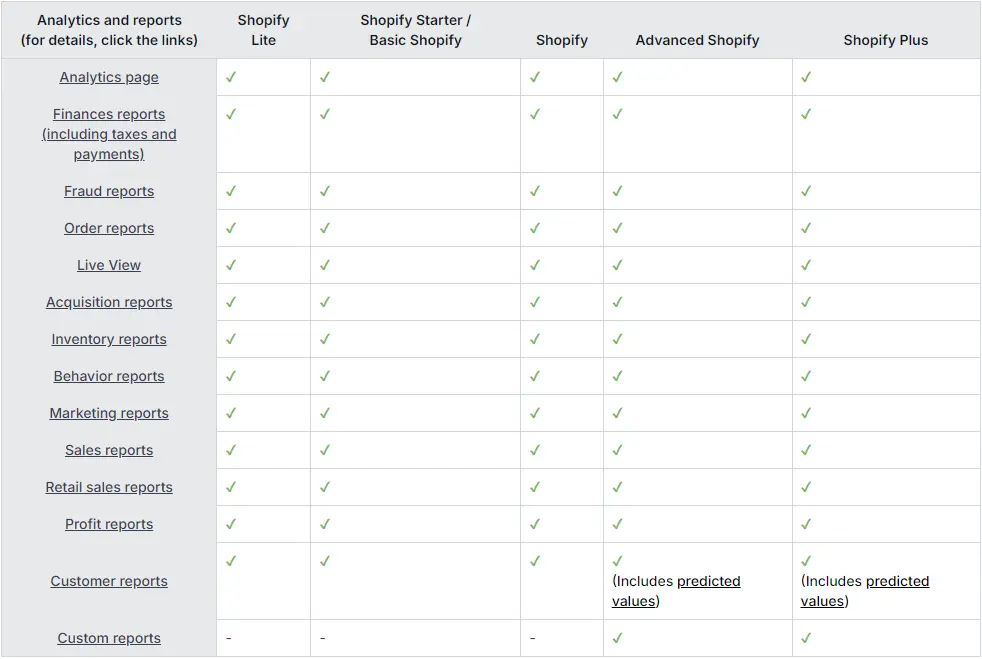
As you can see, all plans give access to reports. Do note that Custom reports are an exclusive feature available only to Advanced and Plus stores.
To access these reports in Shopify, click on Analytics in the left sidebar of the admin screen, and then select Reports.
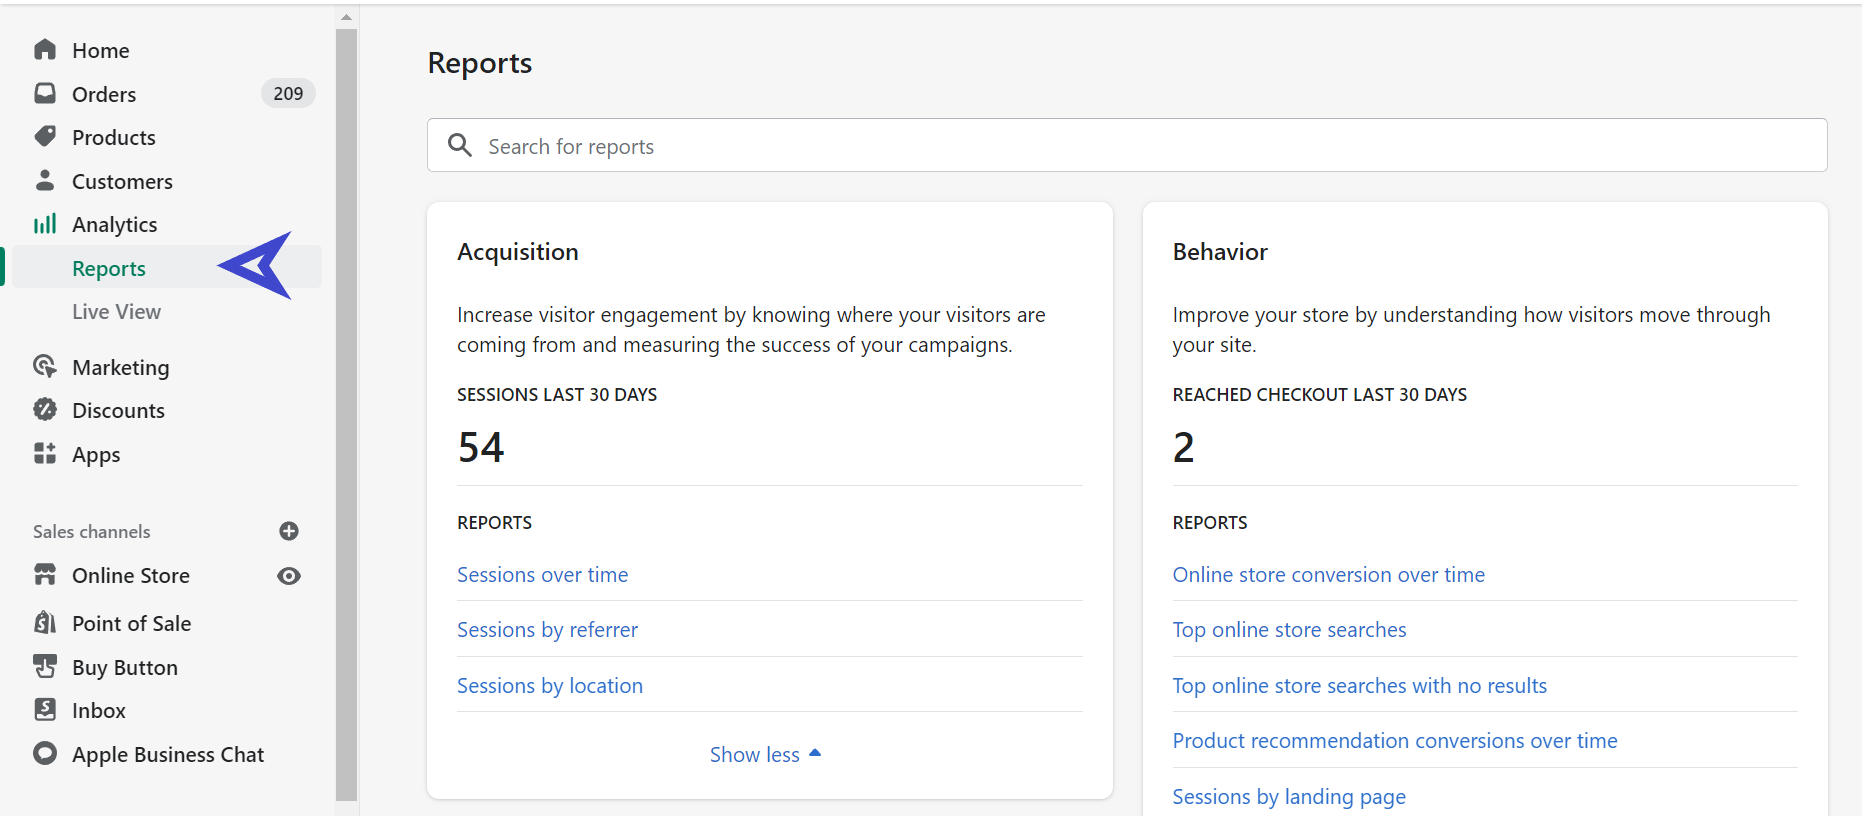
Once there, you can view all the reports available for your store on the right side panel.
Some advance warning: we’re not going to cover specific reports here, as we’ve already done so in our article, The Complete Guide to Shopify Reports. But we will focus on the significance of Shopify reporting. So, let’s get started.
Why Shopify Reports Matter
To understand the importance of Shopify reports, let’s take an example of a store selling keto dietary items. We’ll call the store owner Jim for our purpose.
Jim and his team have been doing an exceptional job selling keto merchandise to health-conscious customers. So much so that they’ve become quite popular in their community, and are now opening a retail store in a neighboring area.
While success is definitely trending upward, Jim seems anxious about keeping his day-to-day finances in check. Everything from sales and marketing to inventory, leaves him disoriented as he keeps track of the many details.
Jim considers whether he needs to manually update spreadsheet data or hire a business analyst to do it for him. The latter option seems convenient, but it’s expensive. So, poor Jim decides to stressfully grind away at his daily data chores.

But… What if Jim could get his data without the nerve-racking manual effort? What if he could just click a few buttons and gather all the relevant information?
Seems wonderful, right?
Well, that’s exactly what Shopify reports are about. Shopify enables summarized data collection from a store’s daily e-commerce activities, as well as any POS (Point of Sale) retail locations.
As for Jim (our example), all he needs to do is configure his online store and POS locations, and Shopify takes care of the rest.
If Jim wants to know gross sales recently made by his new local keto dietary store, he just needs to do the following:
Head to the Reports section > Scroll to Finances > Select Summary > Choose Gross Sales from Sales section > Select the date range > Choose the channel (ie Point of Sale) from All Channel > Download the report by using the Export option in the top right corner. That’s it - Super easy!
Not only do Shopify reports make Jim’s job easier, they allow him to concentrate on more important decisions, rather than worrying about mundane tasks.
Of course, there may still be some custom reports for which Jim needs help, even if he subscribes to Shopify’s Advanced or Plus plans. In such situations, established Shopify reporting apps like Report Pundit can lend a hand.
How to Enable Shopify Custom Reports?
Enhanced reports or enhanced reporting is another way of referring to Custom reports, and there are three ways to enable it (so to speak) in shopify:
- By using Manage Filters to generate specific reports
- By upgrading to Advanced or Plus plan types to access custom reports
- By utilizing Report Pundit to create detailed custom reports for a fraction of the cost.
Let’s look at how each of these three options works.
1. By Managing Filters
Except for Finances reports, every other Shopify report type has an option called Manage Filters.
Using these filters, you can get well-defined data based on your needs. For example, suppose you own a clothing store and ran a discount campaign last month to attract customers. Now you want to learn the number of conversions from it.
To get this info, you can visit the Behavior section of reports > click Online store conversions over time > select Last Month from the date range > open Manage Filters > select UTM Campaign name from the drop down > click Apply Filters.
Now, Shopify will display this data and you can export it as a CSV file.
2. By Upgrading to Shopify Advanced or Plus Plans
When you subscribe to the Shopify Advanced or Plus account plans, you get access to Shopify’s custom reports. It’s an added bonus on top of multiple other features gained.
You’ve now paid top dollar for a high-end plan and are ready to make the most out of those custom reports.
Not so fast…
You see, while Shopify custom reports offer flexibility with report creation to suit your needs, they don’t go all the way. This is what we mean:
- Limited number of data columns to add. So, if you need a calculated column with your custom formula in it, you’re out of luck.
- Limited number of custom report type templates. Yes, Shopify decides how “custom” your custom reports get to be. No random reports with custom columns alone.
- No one to ask for custom reports. Not only can you not create fully custom reports from scratch, you can’t get someone from Shopify to do it for you.
- You can’t save a custom report you created within Shopify Reports itself to look up later.
- No multi-store data consolidation. Better improve your shuffling skills if you have many stores worth of reports.
You can learn more about these limitations in our Shopify Reports and Report Pundit: Side-by-Side Guide.
That’s some of many reasons Shopify sellers use Report Pundit to get crucial store details. Some records are simply too difficult to retrieve and/or inaccessible from Shopify alone.
3. By Using Report Pundit
We know it’s a shameless plug, but we at Report Pundit are Shopify-reporting fanatics! We’re also the top-rated partner (1500+ 5-star reviews) on Shopify’s App Store for custom reports.
When you add Report Pundit to your Shopify store, you don’t just get access to some of the best custom reports. You can also fully integrate with brands you know and love: Paypal, Facebook, Klaviyo, Google Analytics, and over 20 different e-commerce related platforms.
Report Pundit offers 125+ different customizable reports for your Shopify store, under the following categories:
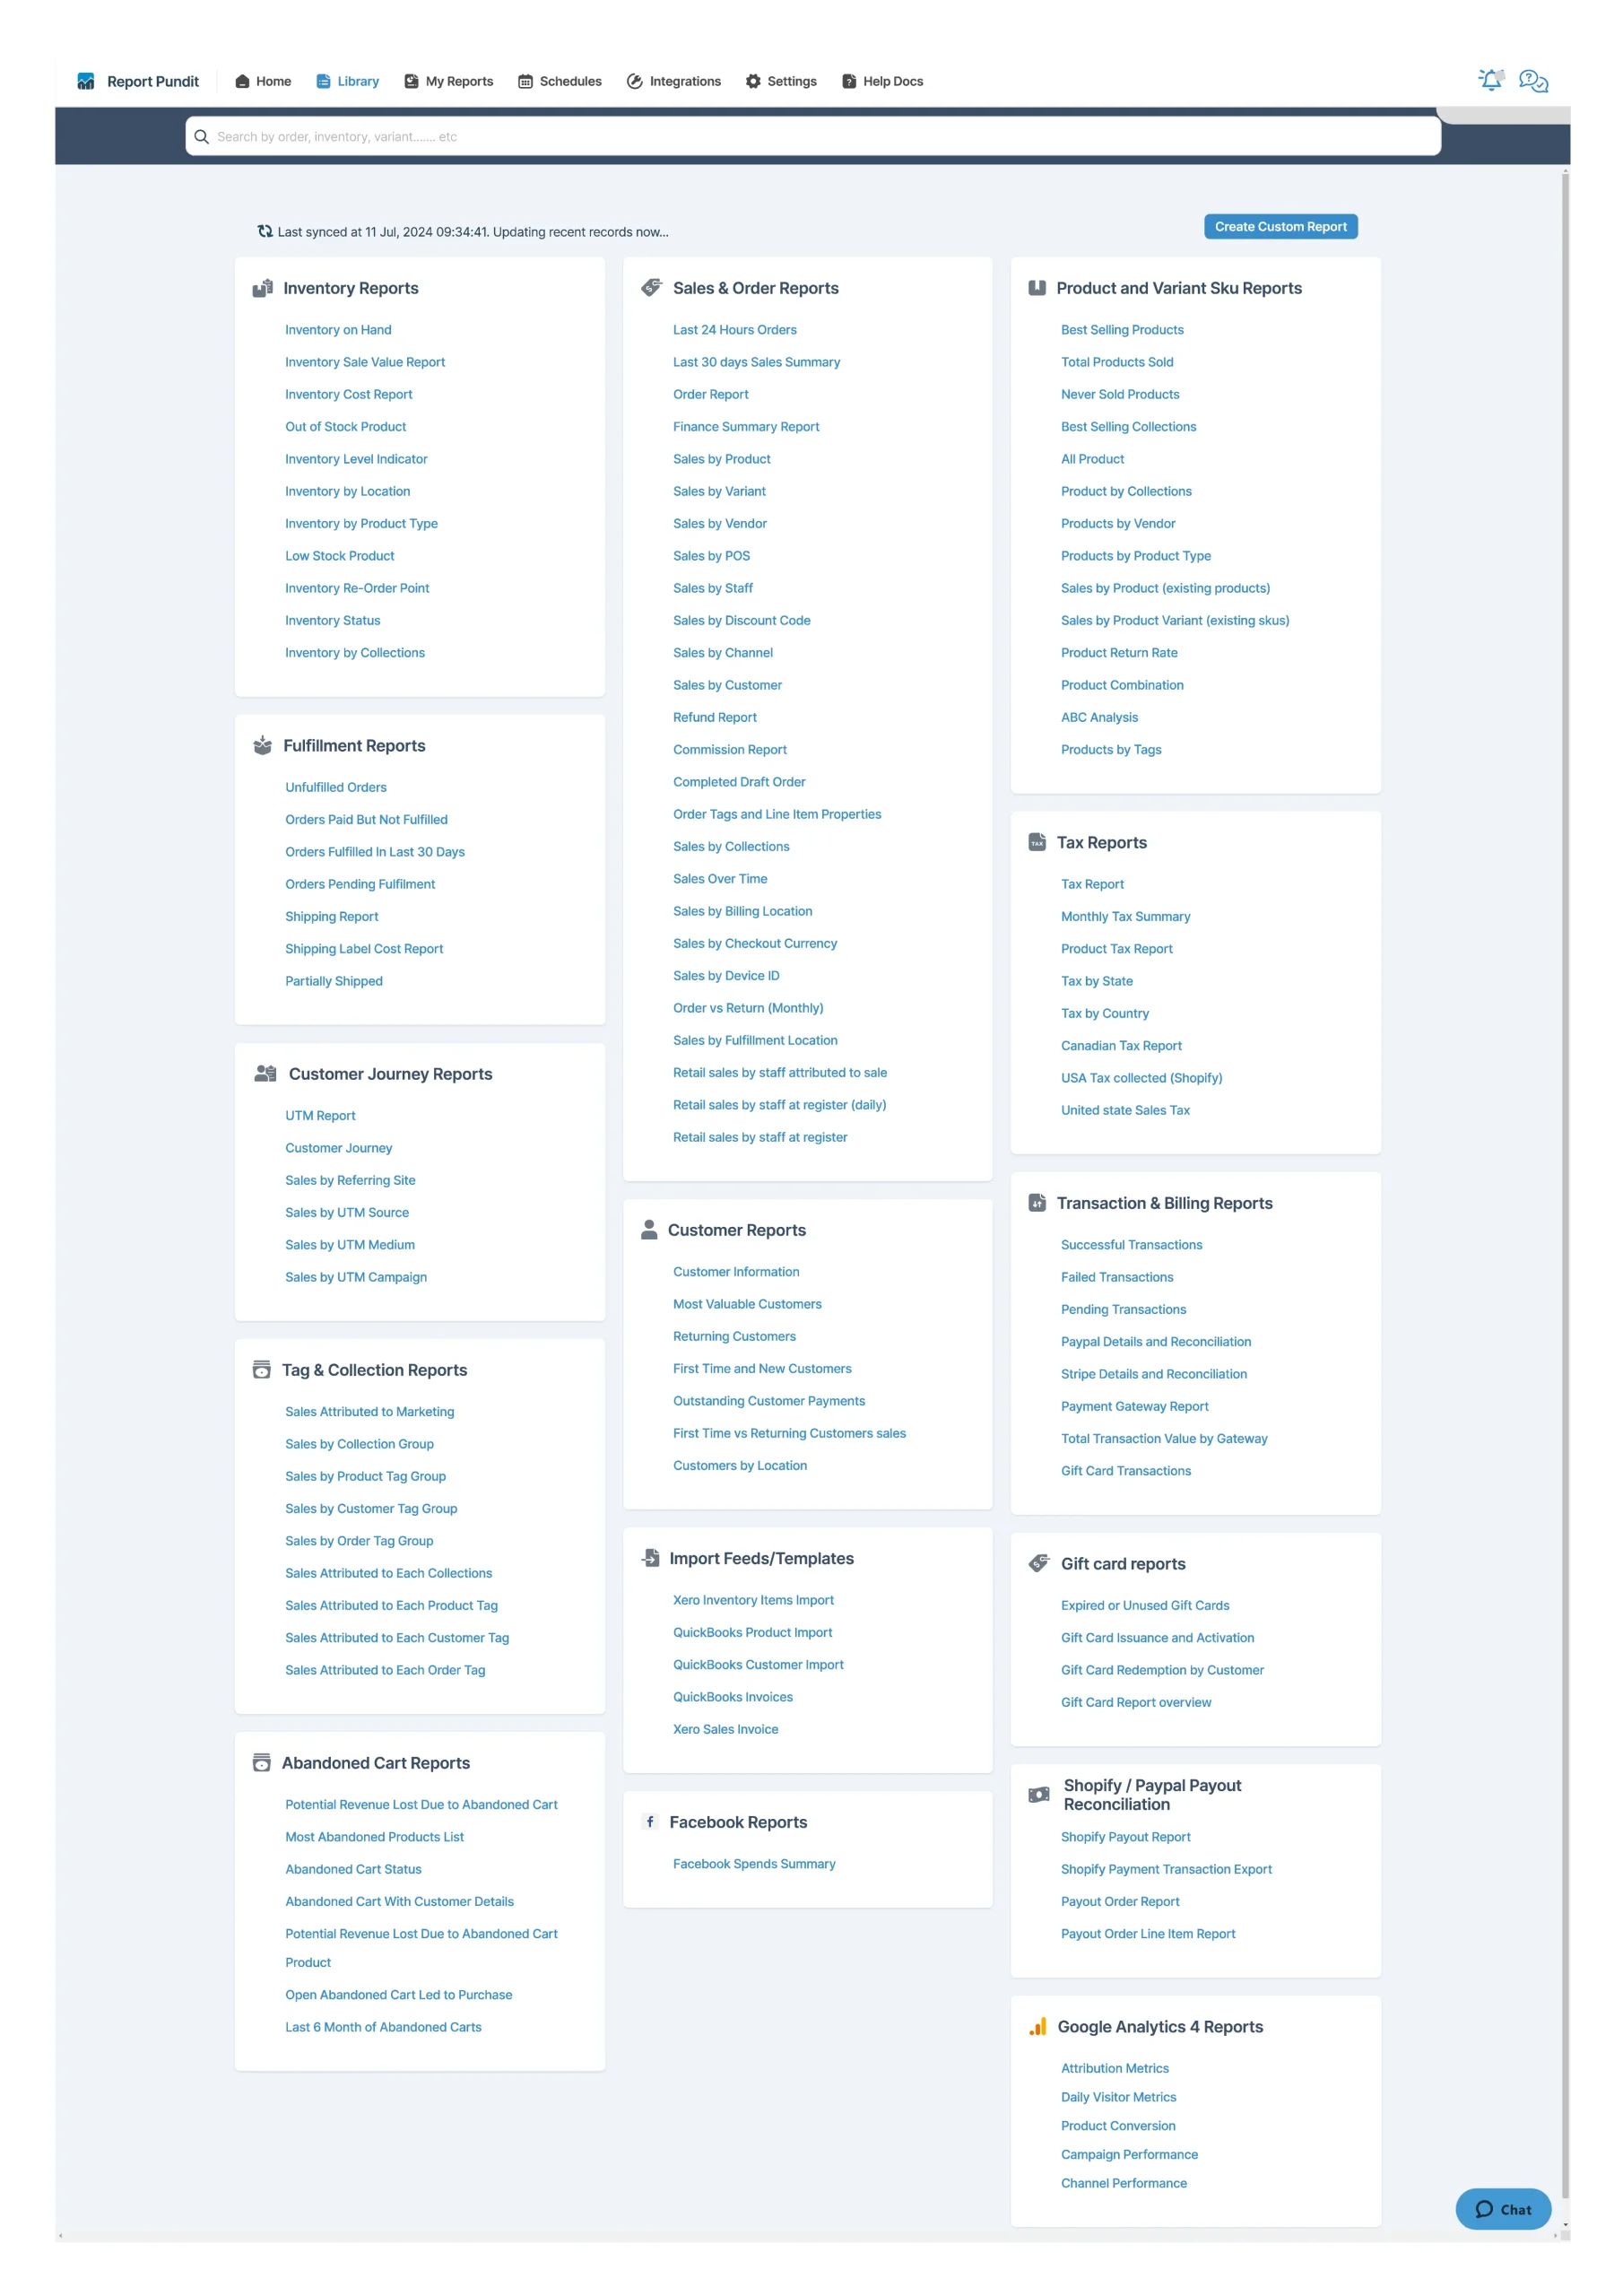
You may notice that many of our reports aren’t available in Shopify; creating these reports manually would require serious time and resources.
So essentially, Report Pundit is not just an app to customize your reports but it helps merchants to pull data that is nowhere available in Shopify.
One good example of that is the Line Item properties, which is common among shopify merchants, but you cannot find it Shopify. Yet you can access this information very easily in Report Pundit.
That’s why over 10000+ Shopify merchants find it super easy to generate advanced and custom reports.
If you’re in a hurry, here is a quick look at the advantages of using Report Pundit for your custom reporting needs:
- High Data Visibility
We give data about every nook and cranny of your Shopify store that Shopify doesn’t dig into. Meaning, you get the full view of everything that’s happening with your store.
- Automation
Schedule your custom reports to arrive where and when you want them, like Google Drive at 10 PM on Tuesday. You can also choose the file format, because we all want change from those useful but boring CSV files right?
- Consolidation
Multi Store data in one report? Check. Adding inventory data in a payout report? Check. When you use Report Pundit, you’ll have many such “checks” for data consolidation.
- Instant Access
Click on a ready made report and go to town modifying it. Customization is that quick and easy with Report Pundit. Or raise a simple request to our expert team with the required criteria and we’ll get it done before you relax.
- No Manual Data Labor
No need to gather multiple reports with various data fields and manually go through them for your desired insights. Report Pundit brings that data to you directly, including hard-to-calculate numerical values.
These advantages are just the tip of the iceberg. Check out our dedicated article on the differences between Report Pundit and Shopify Reports for the full list. Our point - we help you save a ton of time and cost when it comes to your Shopify custom reporting requirements.
Get The Best From Shopify Reporting
The last section may not have portrayed Shopify Reports in the best of light. But the feature can still provide some of the best insights to merchants around the globe.
The multiple templates, customizability, intuitive user interface, and more make it a viable tool for the job of providing your store data. You can find out more about Shopify custom reports in our dedicated blog on it.
If you’re already familiar with Shopify reports or are a veteran Shopify merchant, it’s time to tap into the potential of our fully customized Shopify reports.
You don’t have to take our word for it: try our 14-day free trial and experience it.
We wish you all the best with your e-commerce journey! If you ever have questions about Shopify reporting, then we at Report Pundit are here to help.
Thanks for reading!


Build and automate your Shopify Reporting
Unlock the full potential of your Shopify store with Report Pundit. Gain access to over 2000 data fields, automate reports, and make data-backed decisions to grow your business.