Top 11 Shopify Metrics for Profitable Store Growth

.svg)
.svg)
.svg)
Top 11 Shopify Metrics to Track for Profitable Store Growth
Tracking everything is overwhelming. Tracking nothing is risky.
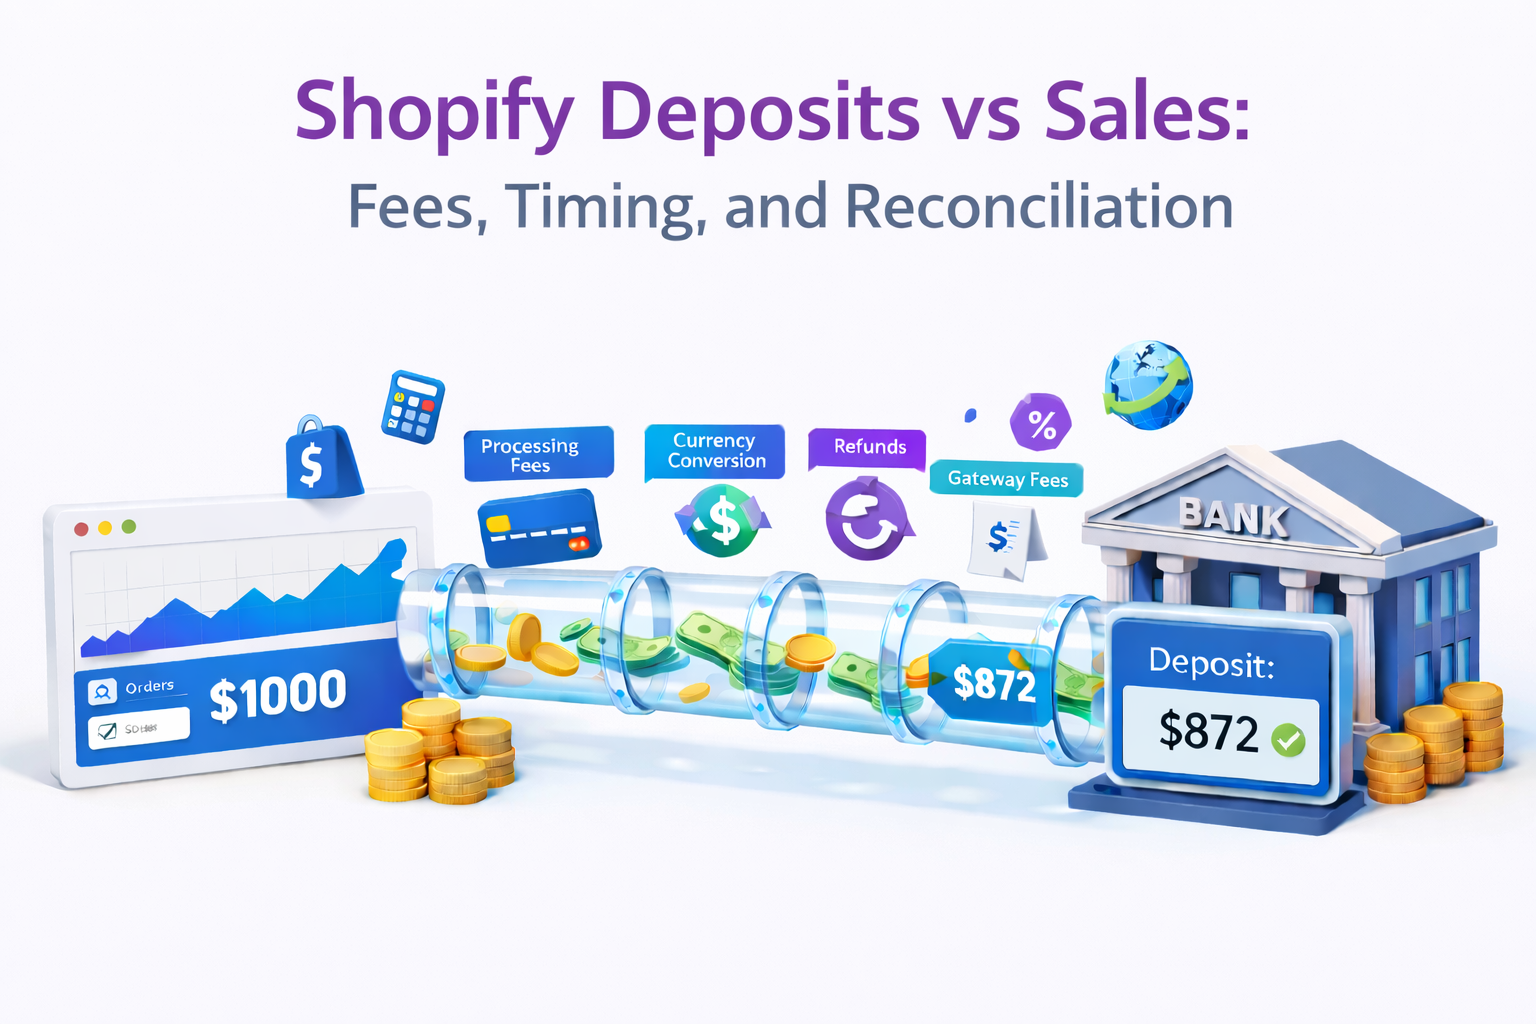
The best approach is to focus on a small set of Shopify metrics that show whether your store is growing in a healthy way. Sales matter, but sales alone do not prove profitability. A store can generate strong revenue and still lose money because of high product costs, ad spend, refunds, discounts, shipping, or poor inventory decisions.
Shopify gives merchants useful native reporting across sales, sessions, conversion, customers, inventory, and product performance. The challenge is knowing which numbers deserve your attention and how to connect them into a clear operating view. Shopify’s analytics dashboard and reports can show key sales, sessions, and fulfillment metrics, while reports can be customized for deeper analysis when needed.
The Difference Between Tracking Metrics and Running the Store by Metrics
A metric is only useful when it changes a decision.
Average order value helps pricing and bundling. Conversion rate helps improve product pages and checkout. Customer acquisition cost helps control ad spend. Inventory sell-through helps purchasing. Profit margin helps decide whether growth is actually worth it.
The mistake many merchants make is reviewing metrics separately. AOV going up sounds good, but it may not matter if discounting killed margin. Traffic growth sounds good, but not if conversion rate falls. ROAS sounds good, but not if customers never return.
The goal is not to create a dashboard full of numbers. The goal is to track the few numbers that explain revenue quality, profit quality, customer quality, and inventory health.
1. Gross Profit Margin and Net Profit Margin
Revenue tells you how much you sold. Profit margin tells you how much you kept.
Gross profit margin shows how much is left after the direct cost of the products sold. In Shopify, cost of goods sold depends on product cost data being configured correctly. Missing costs can make profitability reports incomplete or misleading.
Net profit margin goes further. It looks at what remains after broader costs such as ad spend, app fees, payroll, shipping absorbed by the business, payment fees, and overhead.
Formula:
Gross Profit Margin = [(Net Sales − COGS) ÷ Net Sales] × 100
Net Profit Margin = (Net Profit ÷ Net sales ) × 100
Net Profit = Net Sales − Cost of Goods Sold (COGS) − Operating Expenses − Taxes − Interest & Others
A product can sell well and still be weak if its margin is too thin. If margin is shrinking while revenue grows, the store may be buying growth at the expense of profitability.
2. Average Order Value
Average order value, or AOV, shows how much a customer spends per order on average.
Formula:
Average Order Value = Total sales ÷ Number of Orders
In Shopify analytics, average order value is calculated as Total Sales minus discounts, divided by orders. That distinction matters because discounts affect the value of the order before you judge whether upsells, bundles, or free-shipping thresholds are working.
AOV is useful because it helps you increase revenue without needing more traffic. If paid acquisition is getting expensive, raising AOV can improve the economics of the same visitor volume.
AOV usually improves through bundles, cross-sells, post-purchase offers, volume discounts, free-shipping thresholds, and better product recommendations. The key is to raise order value without giving away so much discount that margin suffers.
3. Bounce Rate
Bounce rate helps you understand whether visitors are leaving before meaningful engagement happens.
Bounce rate = % of sessions where a visitor left after viewing only one page.
It's a signal of whether your store is capturing attention or losing people immediately.
How to interpret it:
- High bounce rate → visitors aren't finding what they expected, or something is stopping them (slow load, confusing layout, wrong audience)
- Low bounce rate → visitors are exploring multiple pages, which generally means better engagement and higher purchase intent
Formula:
Bounce Rate = 100% − Engagement Rate
A high bounce rate is not always bad. A blog post, size guide, or FAQ page may answer a question quickly. But for product pages, landing pages, collection pages, and paid campaign pages, high bounce often deserves a closer look.
The best way to use bounce rate is by page and traffic source. A product page with high bounce from paid social may need better creative alignment. A landing page with high bounce from search may need stronger product messaging, faster load speed, or clearer purchase intent.
4. Conversion Rate
Conversion rate shows what percentage of visitors complete a desired action, usually a purchase.
Formula:
Conversion Rate = Orders ÷ Sessions × 100
Shopify’s conversion reporting can show how visitors move through the funnel, including all sessions, sessions with cart additions, sessions that reached checkout, and sessions that completed checkout. That makes conversion rate more useful than a single final number because you can see where shoppers drop off.
If sessions are strong but conversion is weak, the issue is usually not traffic volume. It is friction. Product pages may lack trust signals. Shipping may feel unclear. Checkout may feel slow. Mobile layout may be poor. Payment options may not match customer expectations.
Conversion rate is one of the fastest metrics to improve because small changes can affect every visitor who already lands on the store.
5. Customer Acquisition Cost
Customer acquisition cost, or CAC, shows how much it costs to win a new customer.
Formula:
CAC = Total Marketing and Sales Cost ÷ New Customers Acquired
CAC is one of the most important paid growth metrics because it tells you whether your acquisition engine can scale. A store with a $25 gross profit per first order cannot keep spending $40 to acquire each customer unless repeat purchases make the math work later.
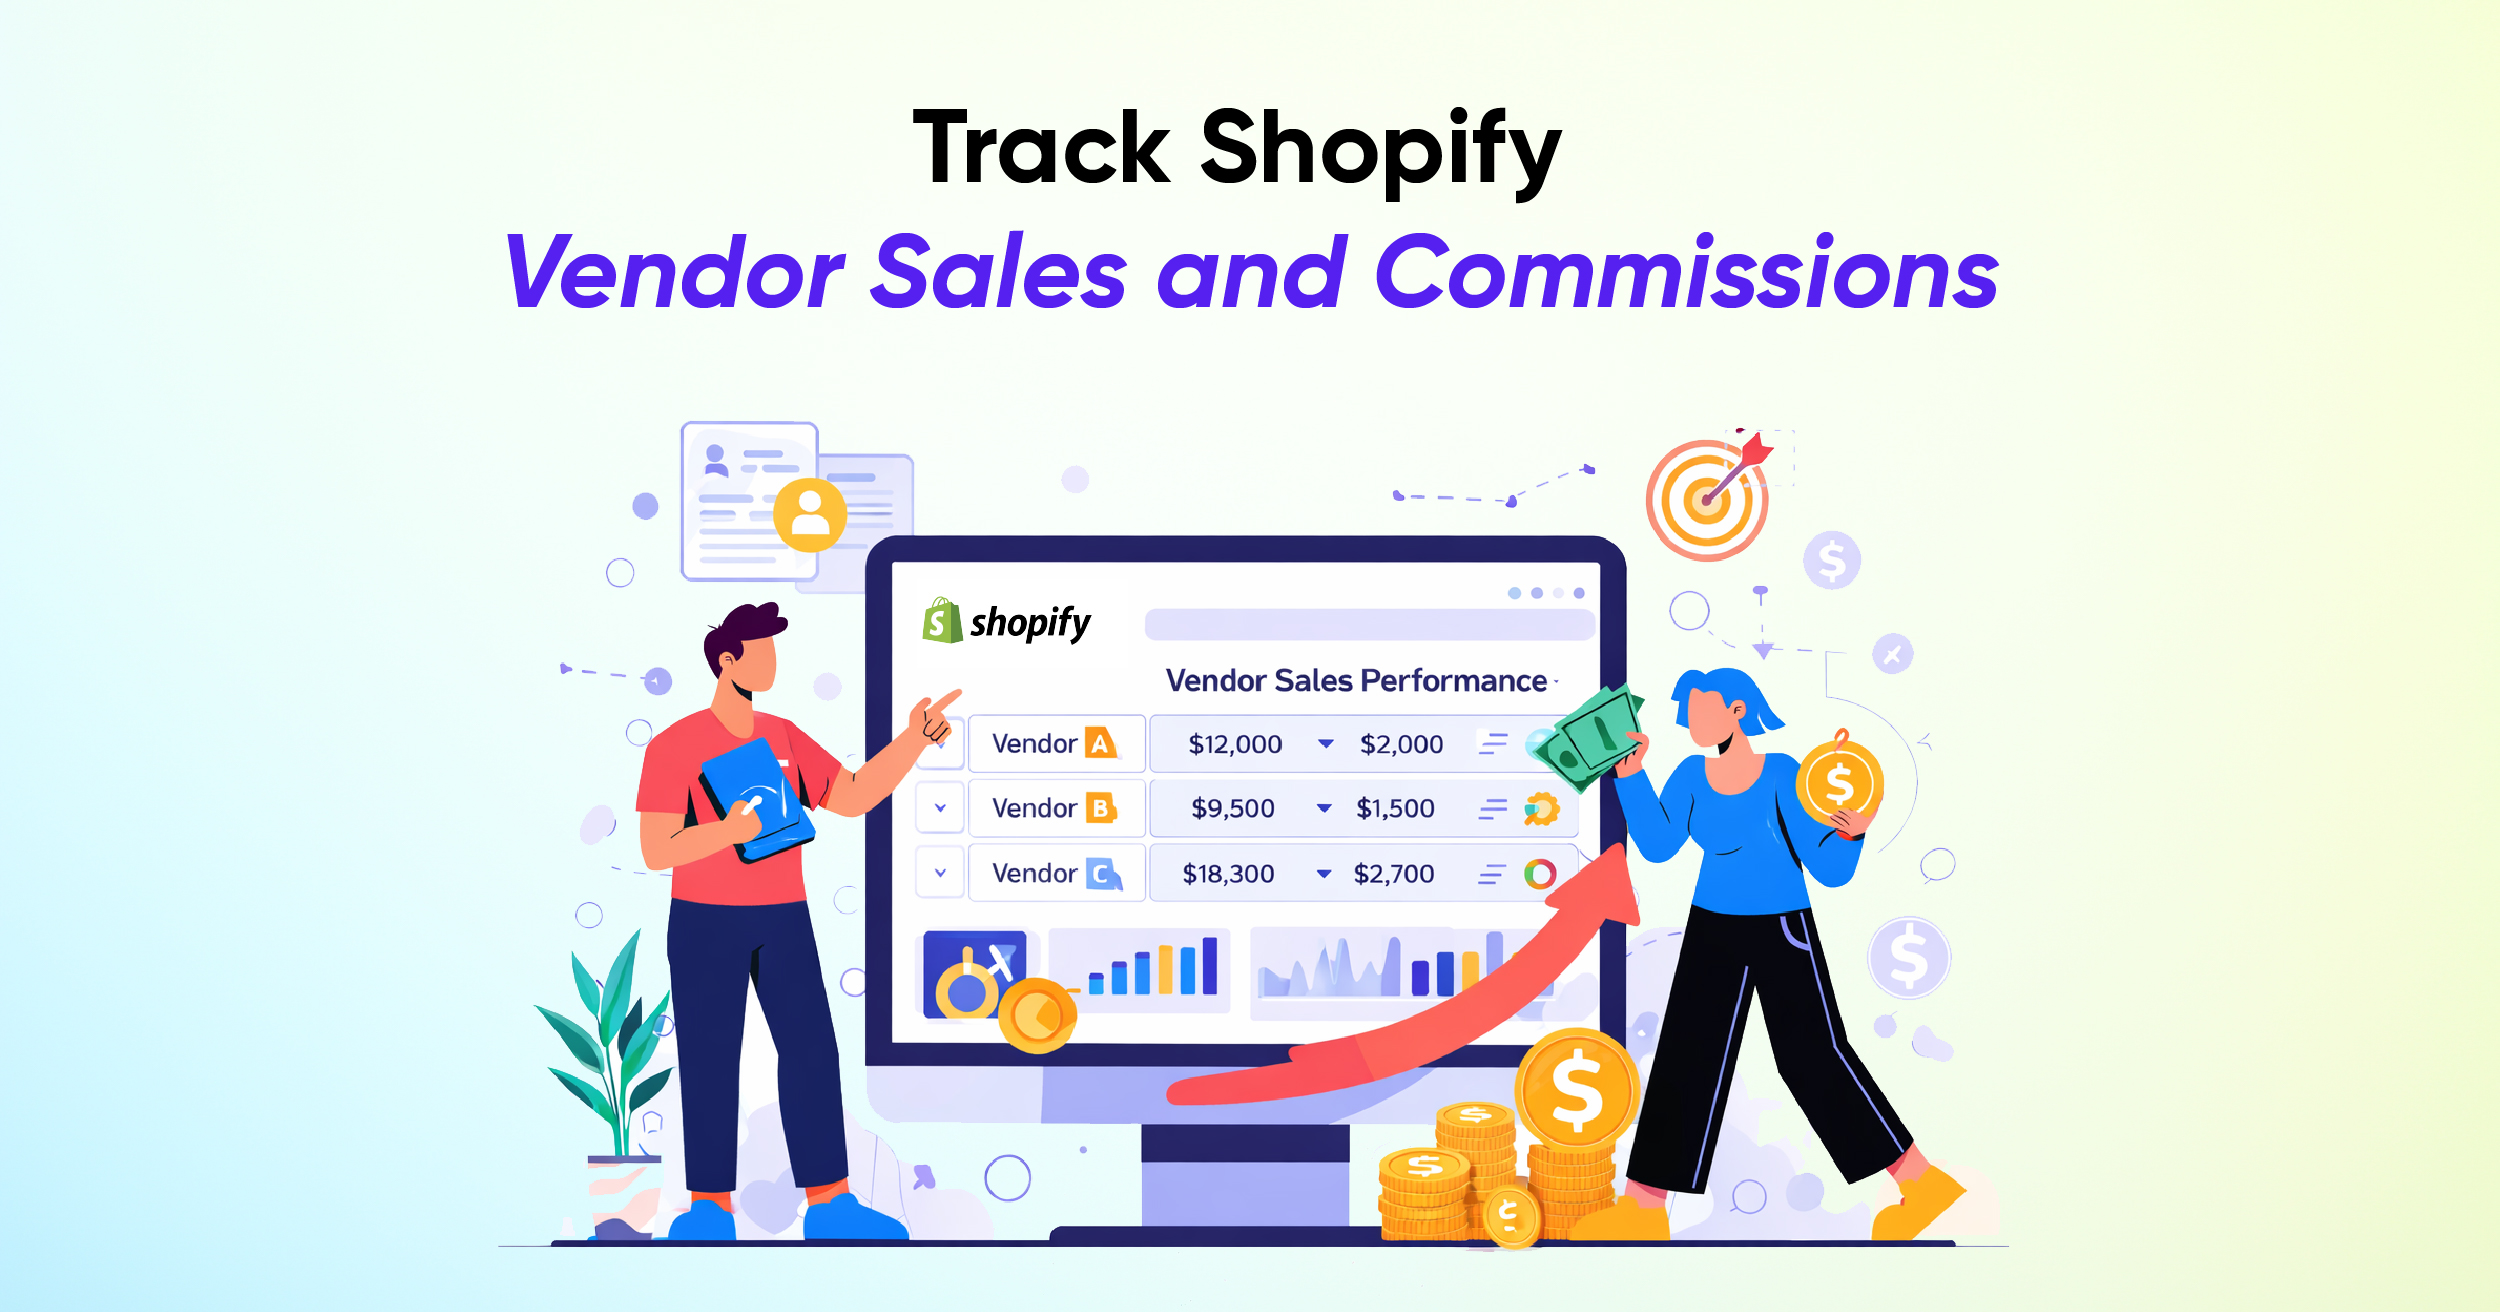
The real value comes from tracking CAC by channel. Paid search, paid social, influencer campaigns, affiliates, email capture campaigns, and marketplaces can all produce different acquisition costs and customer quality. A channel with a higher CAC may still be worth it if it brings customers with stronger lifetime value.
CAC should never be reviewed alone. It needs to be read alongside gross margin, AOV, repeat purchase behavior, and CLV.
6. Customer Lifetime Value
Customer lifetime value, or CLV, estimates how much value a customer brings over the relationship with your store.
A simple formula:
CLV = Average Purchase Value × Purchase Frequency × Customer Lifespan
For Shopify merchants, the more practical question is often: which customer groups spend more, return more often, and deserve more retention effort? Shopify’s customer reporting includes returning customers, one-time customers, customer cohort analysis, amount spent per customer, average order value, repeat purchase behavior, and cohort-level details that help merchants evaluate customer quality over time.
CLV helps answer a difficult growth question: how much can you afford to spend to acquire a customer?
If your store has strong repeat purchase behavior, you can usually afford a higher CAC than a store where most customers buy once and disappear. This is why retention, loyalty, subscriptions, replenishment reminders, and post-purchase email flows matter so much.
7. Cart Abandonment Rate
Cart abandonment rate shows how often shoppers add products to cart but do not complete the purchase.
Formula:
Cart Completion Rate = Completed Purchases ÷ Carts Created × 100
Cart Abandonment Rate = 100 − Cart Completion Rate
Cart abandonment is a checkout and trust signal. It can point to unexpected shipping costs, limited payment methods, long delivery times, weak return policies, forced account creation, or uncertainty around product quality.
Shopify’s conversion funnel reporting helps merchants see how sessions move from all visits to cart additions, checkout, and completed checkout. That makes it easier to separate product-page problems from checkout problems.
The fix depends on where the drop-off happens. If visitors are not adding to cart, the product page needs work. If carts are created but checkout is not reached, shipping, price, or trust may be the issue. If checkout is reached but not completed, payment options, delivery expectations, or final costs may be creating friction.
8. Return on Investment and Return on Ad Spend
ROI measures whether an investment produced more value than it cost.
Formula:
ROI = (Return from Investment − Cost of Investment) ÷ Cost of Investment
Return on ad spend, or ROAS, is more specific. It compares revenue generated from advertising against ad spend.
Formula:
ROAS = Revenue Attributed to Ads ÷ Ad Spend
ROAS is useful for campaign review, but ROI is broader. A campaign can show strong ROAS while still producing weak profit if discounts, shipping, returns, product cost, or fees eat the margin.
This is why marketing metrics should connect back to profitability. If a campaign produces high revenue but low contribution margin, scaling it may create more work without creating more profit.
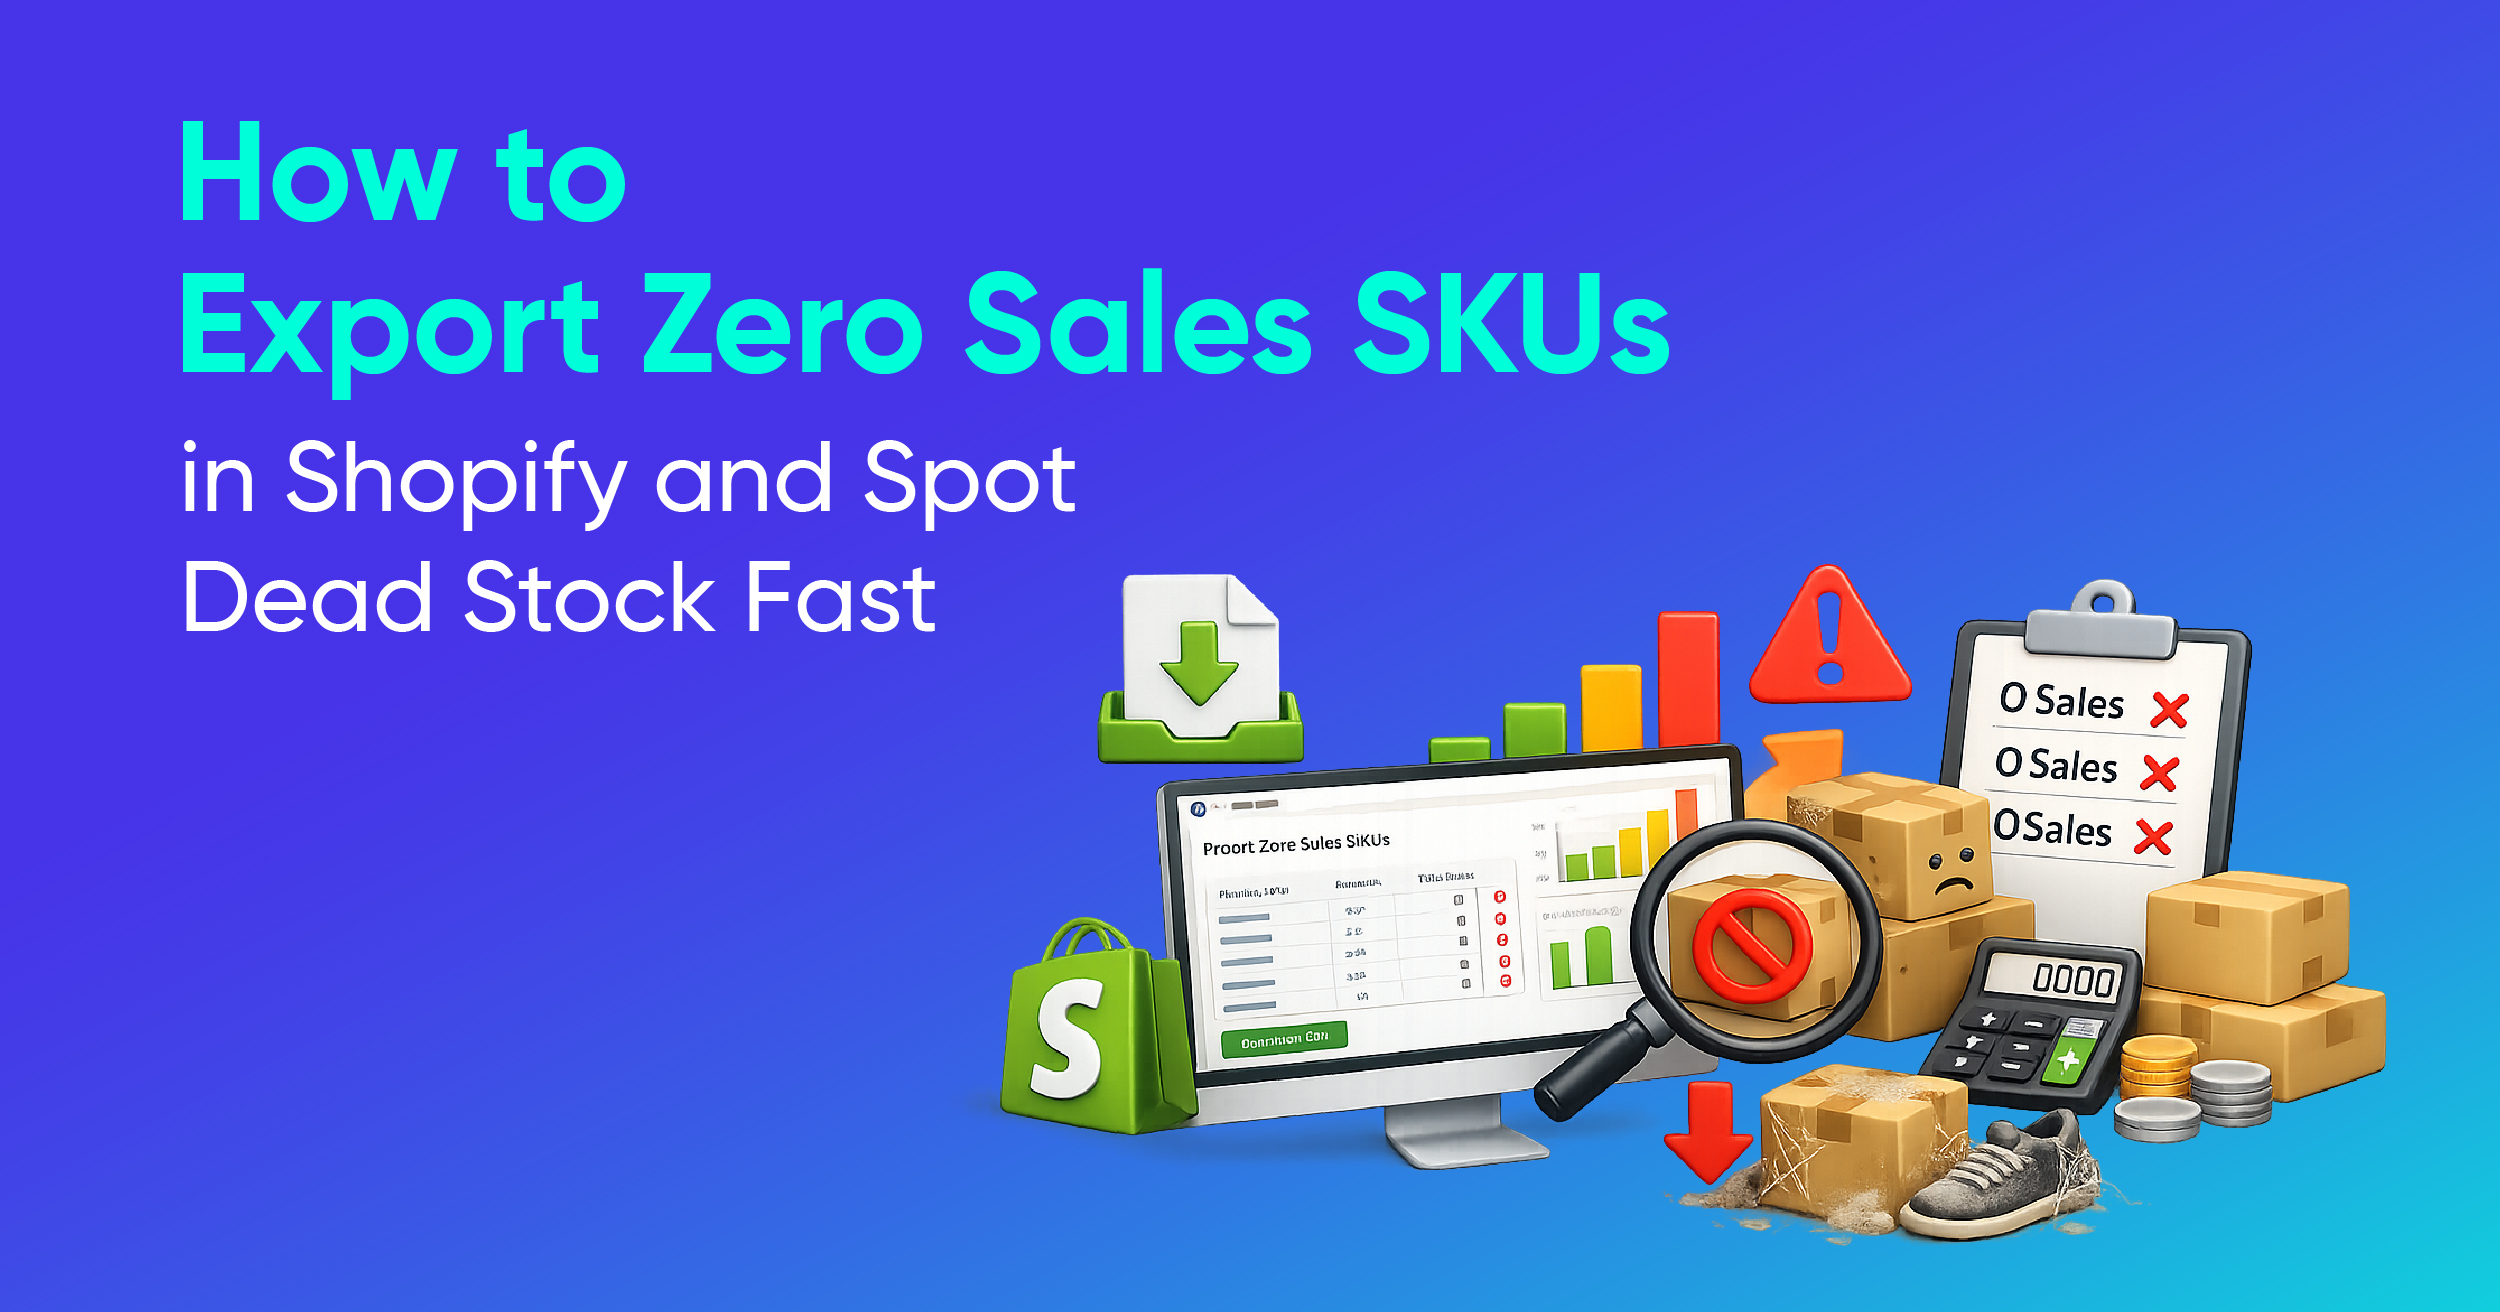
9. Inventory Turnover and Sell-Through
Inventory metrics show whether your money is sitting on shelves or moving through the business.
The classic inventory turnover formula is:
Inventory Turnover = COGS ÷ Average Inventory Value
Shopify also gives merchants inventory-focused metrics such as sell-through rate, days of inventory remaining, inventory value, ABC analysis, average inventory sold per day, and inventory adjustment changes. Sell-through rate is calculated as quantity sold divided by the quantity sold plus the quantity still in inventory. Days of inventory remaining estimates how long tracked stock may last based on ending quantity and average quantity sold per day.
This matters because fast-moving products need replenishment before stockouts happen, while slow-moving products may need pricing changes, bundling, promotions, or purchasing cuts.
Inventory metrics are not just operations metrics. They affect cash flow, margin, ad performance, customer experience, and storage costs.
10. Average Session Duration
Average session duration shows how long visitors spend on your store during a session.
Formula:
Average Session Duration = Total Session Duration ÷ Number of Sessions
How Shopify defines a session:
- Sessions are tracked via cookies stored on the visitor's device.
- A session ends after 30 minutes of inactivity or at midnight UTC — whichever comes first.
- The same visitor can have multiple sessions (e.g., a visitor who leaves and returns after 30+ minutes generates a new session).
This metric needs context. A longer session is not always better if the customer is confused and cannot find what they need. A shorter session is not always bad if the customer lands on the right product and buys quickly.
Use session duration with conversion rate, bounce rate, and traffic source. If sessions are short and conversion is low, the page may not match visitor intent. If sessions are long and conversion is low, shoppers may be interested but not convinced.
11. Traffic Sources
Traffic sources show where visitors come from before they reach your store.
This can include organic search, paid search, paid social, email, direct traffic, referrals, affiliates, marketplaces, and social platforms. Shopify’s marketing and traffic reporting can show traffic sources, sessions, conversion rate, orders, and order value by source, depending on the report and available tracking data.
Traffic source reporting matters because not all traffic is equal. A channel that brings thousands of sessions but few orders may be less valuable than a smaller channel that converts well and brings repeat buyers.
The best view combines traffic, conversion rate, revenue, AOV, CAC, and customer quality. That helps separate vanity traffic from profitable traffic.
How to Read These Metrics Together
No single metric tells the whole story.
AOV and conversion rate show how well the store turns traffic into revenue. Gross and net margin show whether that revenue is profitable. CAC and CLV show whether growth can scale. Cart abandonment and bounce rate show where shoppers are leaving. Inventory turnover and sell-through show whether purchasing decisions match demand. Traffic source data shows which channels deserve more attention.
The strongest Shopify reporting workflow connects these metrics instead of treating them as separate dashboards. That is how merchants move from “sales went up” to “profit improved because the right products sold through the right channels at the right margin.”
Where Shopify Tracks These Metrics Natively
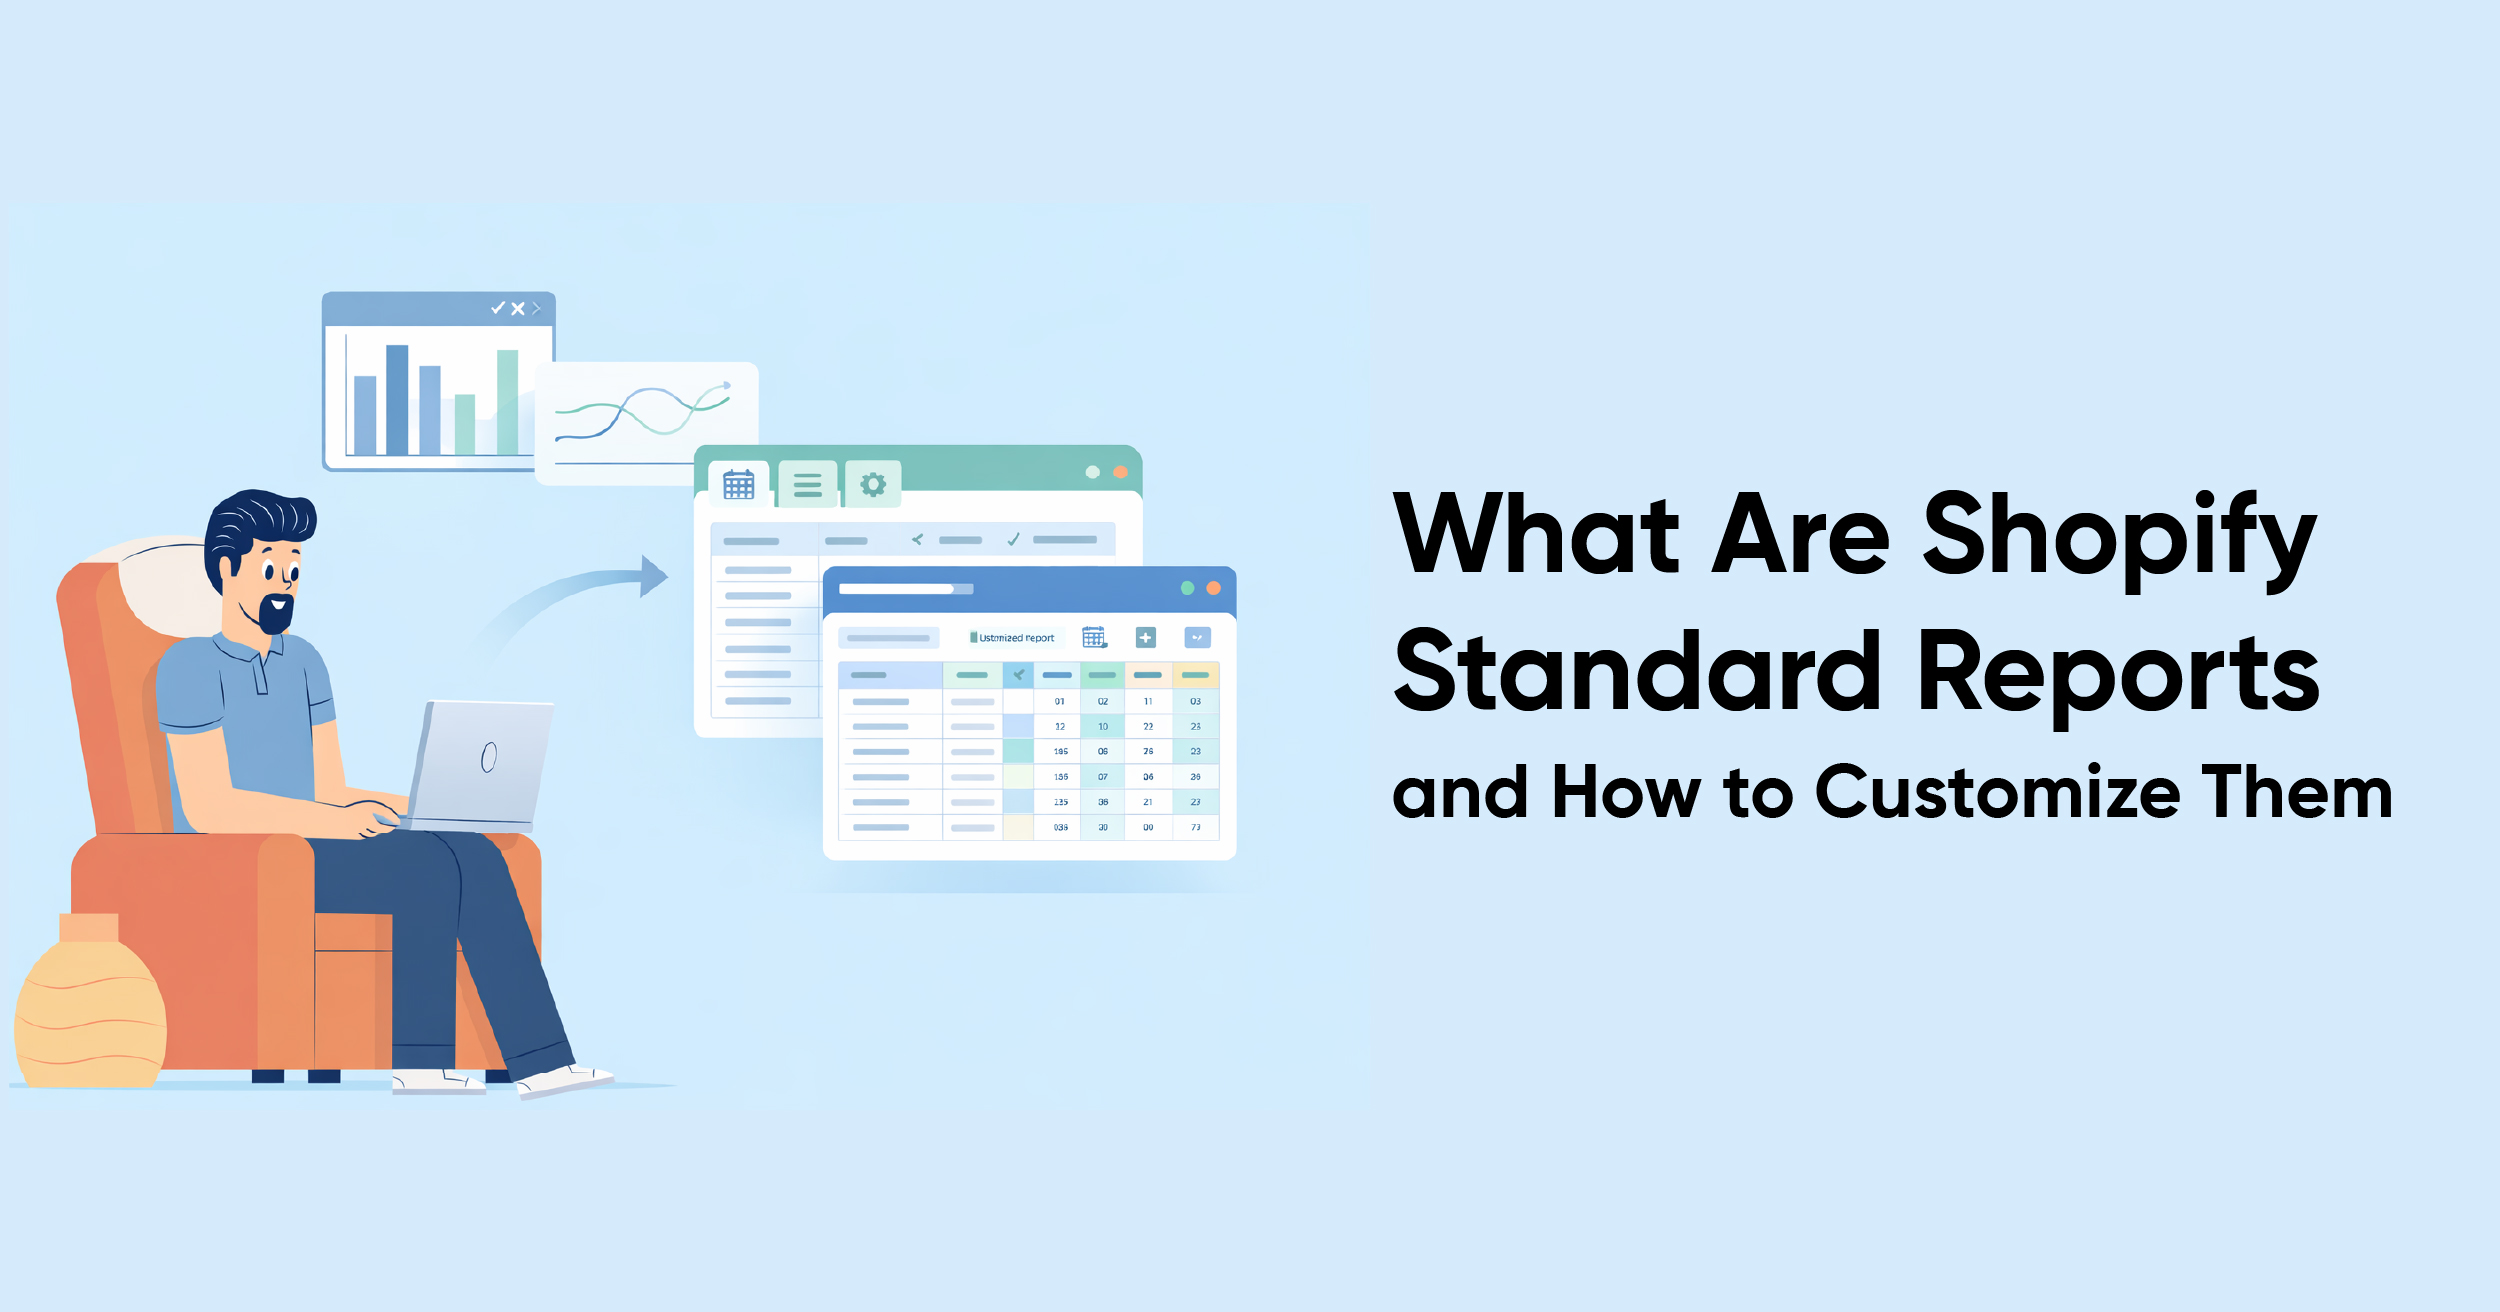
Many of these metrics can be reviewed inside Shopify through the Analytics dashboard, default reports, product analytics, customer reports, behavior reports, marketing reports, and inventory reports. The Shopify mobile app can also display selected metrics such as total sales, net sales, average order value, total orders, visitors, sessions, conversion rate, fulfilled orders, and delivered orders through widgets.
The limitation is not always access to the metric. It is often the workflow around the metric.
A founder may want one weekly profit snapshot. A marketer may want CAC, ROAS, revenue, and customer quality by channel. An inventory team may want sell-through, days remaining, and product sales by vendor. A finance team may want margin, refunds, fees, taxes, and payouts together. Those workflows usually need more than one default view.
How Report Pundit Helps Track Shopify Metrics More Clearly
Instead of checking several Shopify reports, exporting files, adding formulas, and combining data manually, merchants can build reports around the exact metrics their teams review. That can include sales, profit, AOV, inventory, customer reports, custom fields, filters, tags, metafields, connected platform data, and scheduled delivery. The existing metric guidance highlights ready-made report templates, custom fields, filters, tags, metafields, connected data, and automated delivery as part of the reporting workflow..
Report Pundit is a custom reporting app for Shopify that lets merchants build tailored reports across orders, products, inventory, and customers going far beyond Shopify's built-in analytics. It fills the gap when default dashboards don't answer specific business questions.
GA4 shows conversion rates, but Report Pundit lets you verify those against real Shopify orders. Compare GA4's attributed revenue with what actually landed in your Shopify admin — the numbers often differ due to tracking gaps, ad blockers, or consent banners.
GA4 tells you which product pages get traffic. Report Pundit tells you which products actually sell, get returned, or sit in inventory. Combining both shows you the full funnel — from discovery to profit.
Stop toggling between Shopify admin, GA4, ad platforms, and spreadsheets. Report Pundit consolidates your Shopify data into a single reporting hub where everything lives together and makes sense together.
Common Mistakes to Avoid
The first mistake is tracking too many metrics. A dashboard with 40 numbers can look impressive and still fail to guide decisions.
The second mistake is treating revenue as profit. Sales growth is only healthy when costs, refunds, discounts, shipping, ad spend, and inventory risk are under control.
The third mistake is reading marketing metrics without customer quality. A campaign that drives cheap first orders may still be weak if those customers never return.
The fourth mistake is ignoring inventory while chasing revenue. A product can be popular and still create problems if it stocks out too often, turns slowly, or ties up too much cash.
The fifth mistake is using averages without segments. Storewide AOV, CAC, CLV, and conversion rate are useful, but the real insight often comes from product, channel, customer type, location, or campaign-level breakdowns.

Conclusion
Profitable growth does not come from tracking every number in your store.
It comes from knowing which metrics explain revenue quality, customer quality, margin, acquisition efficiency, inventory movement, and channel performance. Once those numbers are clear, decisions become easier: what to promote, what to reorder, where to spend, where to cut, and which customers deserve more attention.
Shopify gives merchants a strong starting point for tracking these metrics. Report Pundit helps turn them into repeatable reports that teams can use consistently, without rebuilding the same analysis every week.
FAQ's
What Are the Most Important Shopify Metrics to Track?
The most important metrics are profit margin, average order value, conversion rate, customer acquisition cost, customer lifetime value, cart abandonment rate, ROI or ROAS, inventory turnover or sell-through, bounce rate, average session duration, and traffic sources. Together, they show profitability, customer quality, channel performance, and operational health.
Where Can I See Shopify Metrics?
The main place is Analytics in the Shopify admin. From there, merchants can use dashboards and reports for sales, customers, behavior, marketing, inventory, and product analytics. Some metrics are also available through Shopify mobile widgets.
Does Shopify Show Average Order Value?
Yes. Average order value is available as a Shopify analytics metric, and the field definition calculates it as gross sales minus discounts, divided by orders.
Does Shopify Show Conversion Rate?
Yes. Shopify includes conversion-related reporting, including funnel views that show sessions, cart additions, checkout reach, and completed checkout. This helps identify where visitors drop off before buying.
Does Shopify Show Customer Lifetime Value?
Shopify customer reports include metrics and views that help evaluate customer value, including amount spent per customer, returning customer data, one-time customer data, and customer cohort analysis.
Can Shopify Track Inventory Turnover?
Shopify includes inventory analytics such as sell-through rate, days of inventory remaining, inventory value, ABC analysis, and inventory adjustment changes. Classic inventory turnover may require combining COGS and average inventory value depending on how your accounting workflow is set up.
When Should I Use Report Pundit for Shopify Metrics?
Report Pundit is useful when metric tracking needs custom fields, filters, metafields, connected platform data, scheduled reports, or recurring team-ready views. It is especially helpful when the same set of metrics needs to be reviewed every week without rebuilding spreadsheets manually.


Build and automate your Shopify Reporting
Unlock the full potential of your Shopify store with Report Pundit. Gain access to over 2000 data fields, automate reports, and make data-backed decisions to grow your business.