Product Return Rate Report

Ideally, you want products to only leave your Shopify store. But returns are inevitable. They can happen for many reasons, like misleading product descriptions, damages or defects, delivery delays, sizing or fit issues, poor quality, etc.
While product returns lead to financial losses, customer dissatisfaction, disrupted inventory management, etc., they also present opportunities for growth. Surprised? Let’s understand why.
Examining your product returns lets you uncover a wealth of insights that can help refine your offerings, delight customers, and grow sales. But it’s impossible without the right data, like the return rate for each product. That’s where the Product Return Rate report comes into play.
This report lists the return rates of your products along with related data. Analyze it to find out the reason(s) behind a product’s return rate, identify an acceptable rate, evaluate vendors and more. Use the insights to improve customer satisfaction, efficiency, and profitability.
Embrace the Product Return Rate report as your secret weapon to strengthen customer bonds and reshape your business to meet their sophisticated needs.
How the Product Return Rate Report Works
Calculating your product return rate is expressed with a simple formula:
Return Rate = (No. of Products Returned / No. of Products Ordered)*100
Let's bring this formula to life with a story that hits closer to home:
Imagine Hat Mart: a vibrant online boutique where each hat is a statement piece, from everyday classics to bespoke creations crafted by Phoebe (the owner). She handpicks the standard hats from select artisans and infuses her own spirit into the unique, custom-made designs.
During her latest bi-annual store evaluation, Phoebe found that Hat Mart sold more hats in the last six months than the year before. Her inventory brimmed with all kinds of hats to meet the increased demand, but a puzzle emerged.

She was baffled to see that some hats she thought had found homes were still popping up in her inventory. She quickly realized they were returns, with such high numbers that Hat Mart would never reach its revenue goals if they weren’t fixed.
Phoebe sprang into action, determined to tackle the return issue head-on. She looked into the Product Return Rate report and found that:
- her custom designed hats had the highest return rate
- baseball caps from a particular vendor reached their highest return rate over the last three months (15%)
- sombreros had a low return rate of 8%, with none returned around Cinco de Mayo
- birthday party hats were her best sellers with a zero return rate
- cowboy hats’ return rate consistently hovered around 6%
Armed with these insights, Phoebe started setting things right to reduce Hat Mart’s returns. She replaced the baseball cap vendor, hired staff to interact with customers, fixed glitches in product pages and so on.
Now, Phoebe can focus her energy on embracing new product collections and allocating just a sliver of space for returns.
Looking into Phoebe’s usage of this report for Hat Mart, we learn that it helps:
- Perform Return Rate Analysis
Merchants can precisely calculate the return rate of each product in every order, to identify and address the reasons behind frequent returns.
Ex: In the case of Hat Mart, Phoebe found that one 200-unit baseball cap order had 30 returns. The return rate for this was calculated as:
Return Rate = (No of Products Returned / No of Products Ordered)*100
= (30/200) * 100
= 15%
This return rate helped Phoebe get to the root of her baseball cap issue, ultimately changing her vendor and improving sales.
- Identify Return Rate Trends
Return rate trends highlight customer preferences and peak sales times. For example, Hat Mart's sombreros had no returns during Cinco de Mayo, a helpful insight. Use such insights to revamp return policies, offer enhanced customer support, and more to maximize sales during busy periods.
- Evaluate Product Vendors
Phoebe noticed sizable returns of baseball caps from a particular vendor. After careful evaluation, she decided to secure a different vendor for the caps. Following Phoebe's lead, reevaluating suppliers could also elevate revenue and customer happiness.
- Review Product Descriptions
After reviewing the high return rate, Phoebe found that incorrect product details in the sombrero descriptions caused the returns. Repeat this step with the report to discover similar potential product description errors.
- Keep Store Finances Accurate
Return rate data helps merchants analyze costs associated with shipping, restocking, potential product depreciation, etc. Use this report to maintain accurate financial records by tracking all return-related cash flow.
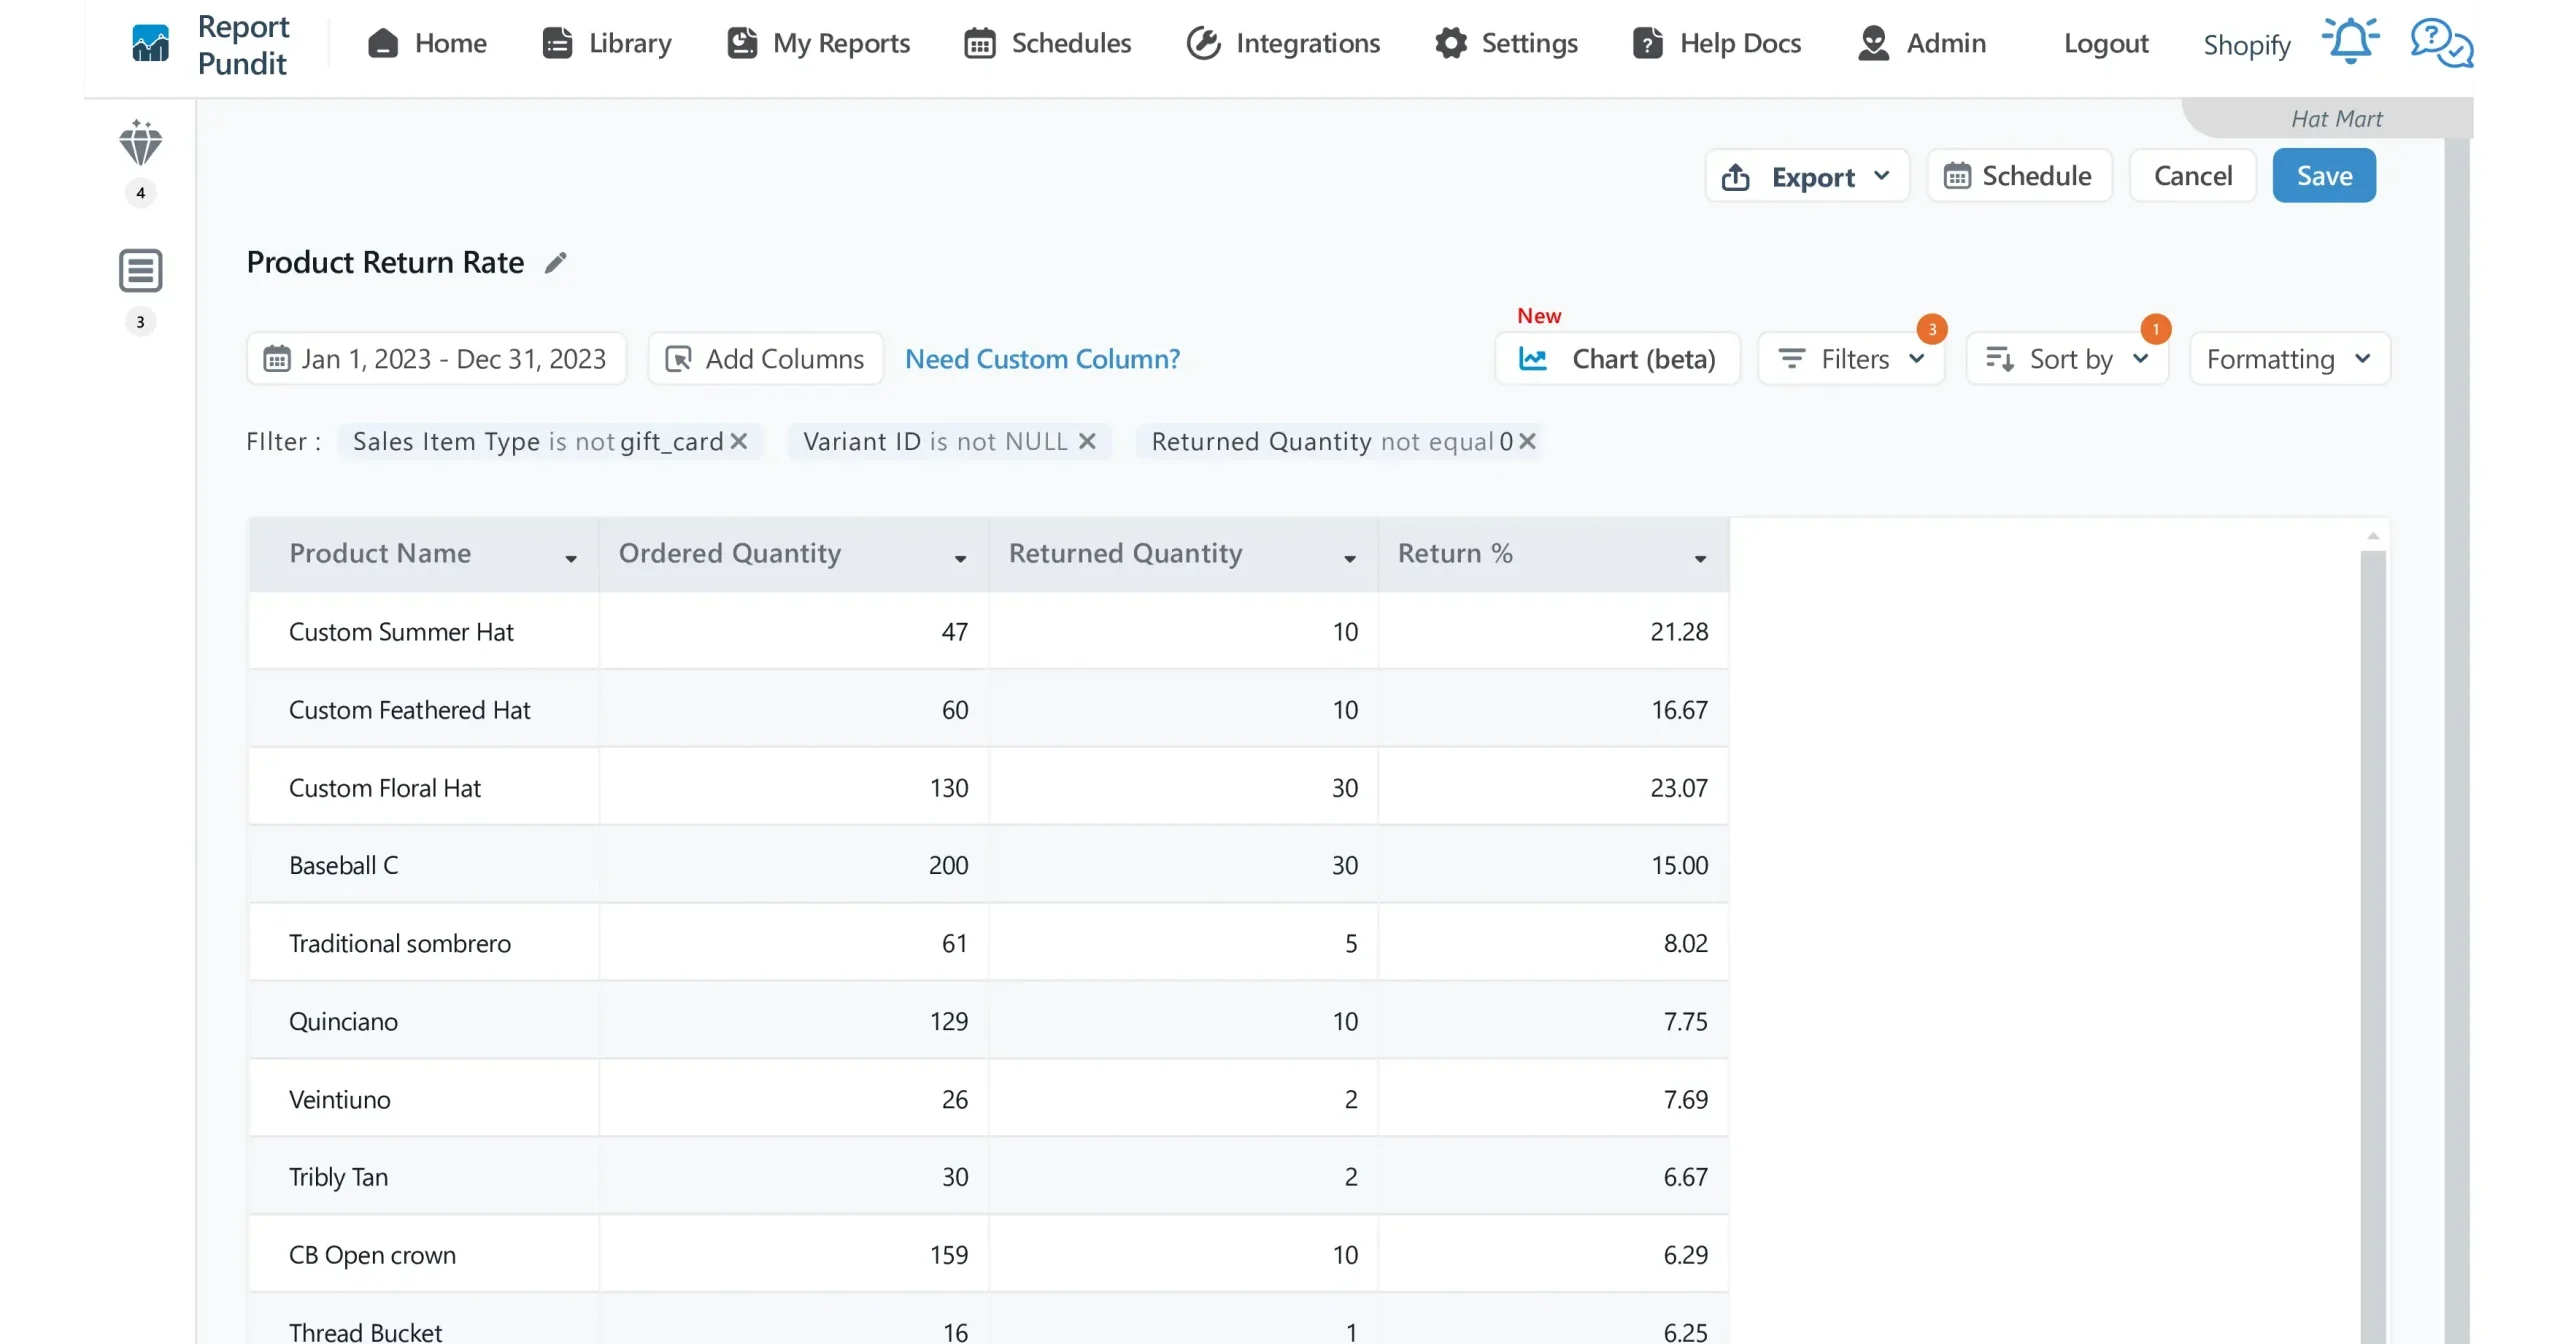
Data Fields in the Product Return Rate Report
The standard fields in this report are:
Product Name: name of the returned product
Ordered Quantity: number of units sold over a specified period as a part of the returned order
Returned Quantity: number of returned units from an order
Return Rate(%): percentage of returned products from an order. Calculated as (Total Returned Quantity/Total Ordered Quantity) *100
Frequently Asked Questions
- Why use the Product Return Rate report?
This report helps:
- Compare the return rate of a product with the average return rate of the store
- Evaluate vendors for product quality
- Review product listings and make the necessary modifications
- Can I include variant/SKU information in this report to find out their return rates?
Certainly, you can customize the report to show variant/SKU data to pinpoint return rates at that level. This could, for example, reveal if a variant image doesn't match reality, which leads to returns. Contact our support team at support@reportpundit.com and we'll set this feature up for you.
- Can I remove one-off return items from this report and include reasons for return instead?
Yes, you can customize your report to exclude one-off return items and include detailed return reasons. This alteration provides valuable insights on return patterns and common causes, lending a hand in your product/service improvement process. Contact us at support@reportpundit.com and our experts will set it up for you.
- Is it possible to view return rates by customers over many years?
Yes. Our team at support@reportpundit.com can set up the Return Rate by Customer report by customizing the Products Return Rate report. You can select the time frame within that report to display data over your desired number of years.
- How to reach the Product Return Rate report in Report Pundit?
Go to: Report Pundit App -> Library -> Product and Variant Sku Reports -> Product Return Rate.


.svg)
.svg)
.svg)

Build and automate your Shopify Reporting
Unlock the full potential of your Shopify store with Report Pundit. Gain access to over 2000 data fields, automate reports, and make data-backed decisions to grow your business.